Pi Network (PI) is recording a steady decline, continuing to trade below the 50-day Exponential Moving Average (EMA) and currently hovering around the $0.2200 mark on Monday. The coin faces the risk of a deeper drop as supply on centralized exchanges (CEX) increases significantly, while the number of mainnet tokens being transferred spikes. Technically, the current outlook for the PI token remains bearish.
Increasing Supply Pressure
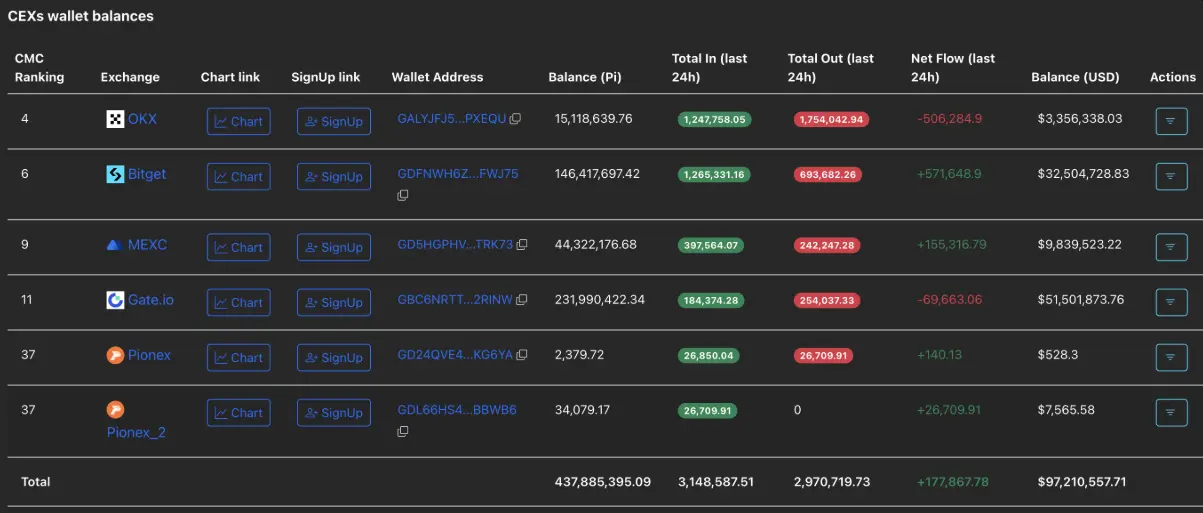
The continuous inflow of PI tokens onto exchanges indicates a clear rise in selling pressure. According to data from PiScan, in the past 24 hours, centralized exchange (CEX) wallets have recorded 177,867 PI deposited, bringing the total balance to 437.88 million tokens.
 PI balance on CEX | Source: PiScan One of the main drivers of this phenomenon is the migration of tokens from testnet to mainnet in Pi Network, as 17.5 million users have completed KYC (Know Your Customer) verification. Notably, thanks to the integration of AI in the KYC process, verification waiting times have been reduced by up to 50%, enabling faster token migration. According to PiScan, as of now in December, more than 6.42 million PI tokens have been migrated to mainnet.
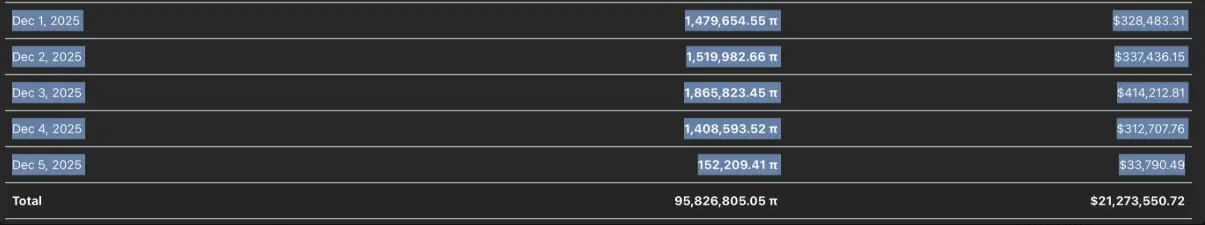 PI migration data | Source: PiScan However, if the network does not generate real demand for the token through practical applications, investor confidence may continue to decline, thereby maintaining or even increasing selling pressure on the market.
Technical Outlook: Targeting $0.1919
Pi Network maintained its pace in Monday’s session after dropping nearly 2% on Sunday. The path of least resistance for the PI token is currently headed toward the $0.1919 low recorded on October 11. If this level is lost, the token is likely to continue plunging toward the record low of $0.1533 set on October 10.
Technical indicators on the daily chart show that selling pressure is clearly increasing. The Relative Strength Index (RSI) oscillates around 43, below the neutral threshold and sloping downward, signaling the potential for further price declines.
 Daily PI/USDT chart | Source: TradingView Meanwhile, the MACD indicator maintains a sell signal as both the MACD line and the signal line remain below zero, reinforcing the bearish pressure.
To reverse course and recover the bullish trend, the PI token needs to quickly break above the 50-day EMA at $0.2394, a key turning point that will determine the strength of the short-term uptrend.
SN_Nour
Disclaimer: The information on this page may come from third parties and does not represent the views or opinions of Gate. The content displayed on this page is for reference only and does not constitute any financial, investment, or legal advice. Gate does not guarantee the accuracy or completeness of the information and shall not be liable for any losses arising from the use of this information. Virtual asset investments carry high risks and are subject to significant price volatility. You may lose all of your invested principal. Please fully understand the relevant risks and make prudent decisions based on your own financial situation and risk tolerance. For details, please refer to
Disclaimer.
Related Articles
Coixa Wallet Applies for Pi Network KYB Certification, Accelerating Ecosystem Utility Transformation
Pi Network ecosystem welcomes major development, with DeFi gateway Coixa applying for KYB certification to standardize operations and enhance network trust. Once approved, it will drive the Pi ecosystem's transformation into practical applications while meeting the latest project requirements, promising to provide users with more services.
GateNews11h ago
Pi Coin Price Brewing 22% Breakthrough: Key Indicator "Goes Silent," $0.20 USD Becomes Bulls-Bears Dividing Line
Pi Network (PI) price is hovering around $0.188, with a slight decline intraday but an 11.6% increase this month. Technical analysis indicates the market is approaching a potential reversal point, showing bullish signals and a cup-and-handle pattern. However, short-term momentum depends on the PISI indicator, which is currently near neutral, suggesting that PI has not yet formed a strong upward trend. The key resistance level is at $0.200; a break above this could lead to further gains toward $0.246. The market still needs to wait for changes in capital flow to trigger a breakout.
GateNews11h ago
Pi Network Bullish Pattern Formation, PISI Indicator Shows 22% Breakout Yet to Come
On March 24, Pi Network (PI) was trading near $0.188, with an overall gain of 11.6%. Hidden bullish divergence and a cup and handle pattern indicate potential for a 22% rally if it breaks through the $0.204 neckline. However, the PISI indicator is near zero, suggesting a lack of independent momentum. The CMF indicator has turned positive, hinting that large capital may be re-establishing positions. The key support level is $0.182, and if it breaks below $0.168, the cup and handle pattern will be invalidated.
MarketWhisper11h ago
