Weekly Analysis: BTC, HNT, ORDI, AVAX, BEAM
BlockchainReporter
Bitcoin price analysis
Bulls have dominated this week as most assets posted gains over the seven days. Bitcoin (BTC) has seen bull activity this week, recording a weekly increase of 10.7% as the price is $43.6K. Bitcoin has a market cap of $854B, and the trading volume stood at $14.6B as of press time.
Volatility on Bitcoin price for the week has been rising as the Bollinger Bands diverge. BTC’s relative strength indicator is above its average line in the overbought region, indicating bull dominance on Bitcoin price over the week.
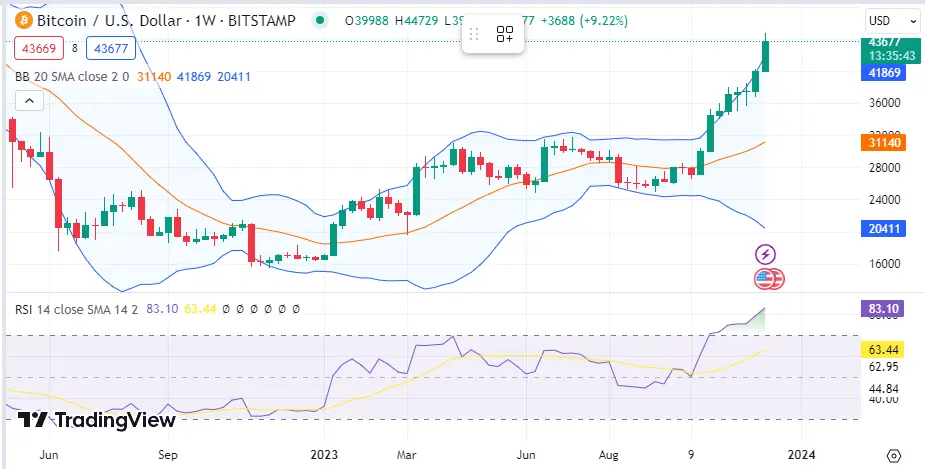 BTC 1-day chart | Source: TradingView## Helium price analysis
Helium (HNT) has seen bull activity this week, recording a weekly increase of 70% as the price is $$4.86. Helium has a market cap of $699M, and the trading volume stood at $10.1B as of press time.
Volatility on Helium price for the week has been rising as the Bollinger Bands diverge. HNT’s relative strength indicator is above its average line in the overbought region, indicating bull dominance on Helium price over the week.
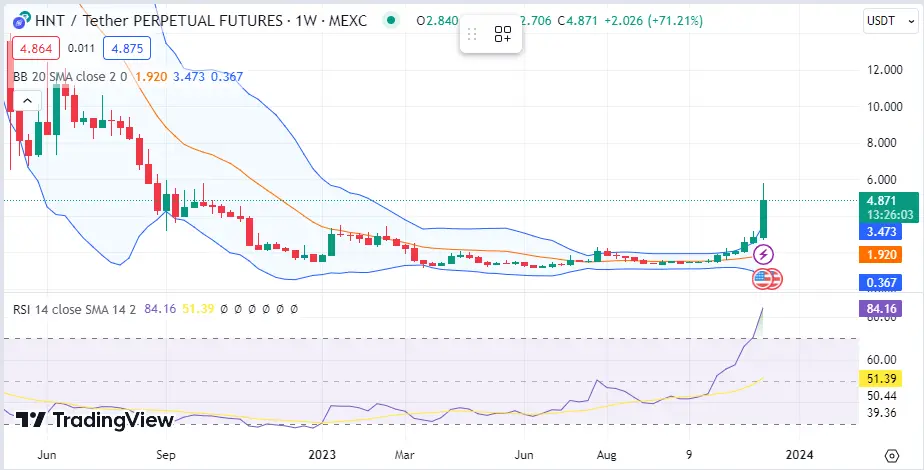 HNT 1-day chart | Source: TradingView## ORDI price analysis
ORDI (ORDI) has seen bull activity this week, recording a weekly increase of 53% as the price is $49.5. ORDI has a market cap of $881M, and the trading volume stood at $881M as of press time.
Volatility on ORDI price for the week has been rising as the Bollinger Bands diverge. ORDI’s relative strength indicator is above its average line in the overbought region, indicating bull dominance on ORDI price over the week.
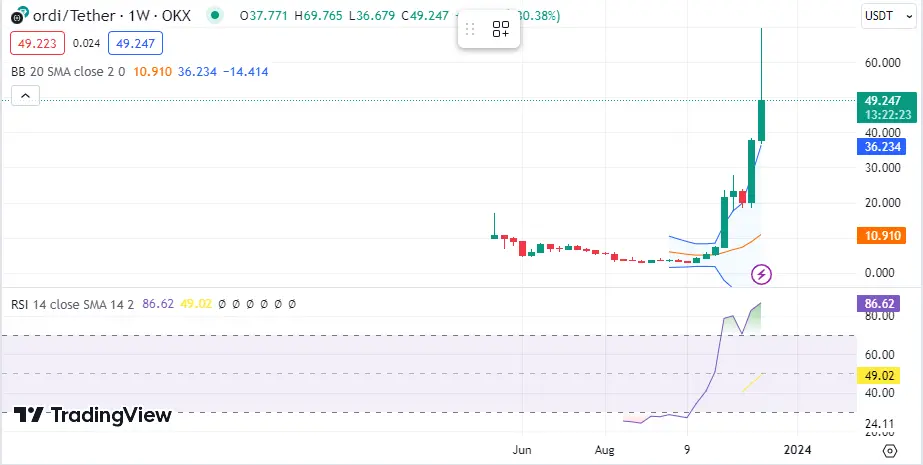 ORDI 1-day chart | Source: TradingView## Avalanche price analysis
Avalanche (AVAX) has seen bull activity this week, recording a weekly increase of 45% as the price is $32.08. Avalanche has a market cap of $1.3M, and the trading volume stood at $1.3B as of press time.
Volatility on Avalanche price for the week has been rising as the Bollinger Bands diverge. AVAX’s relative strength indicator is above its average line in the overbought region, indicating bull dominance on Avalanche price over the week.
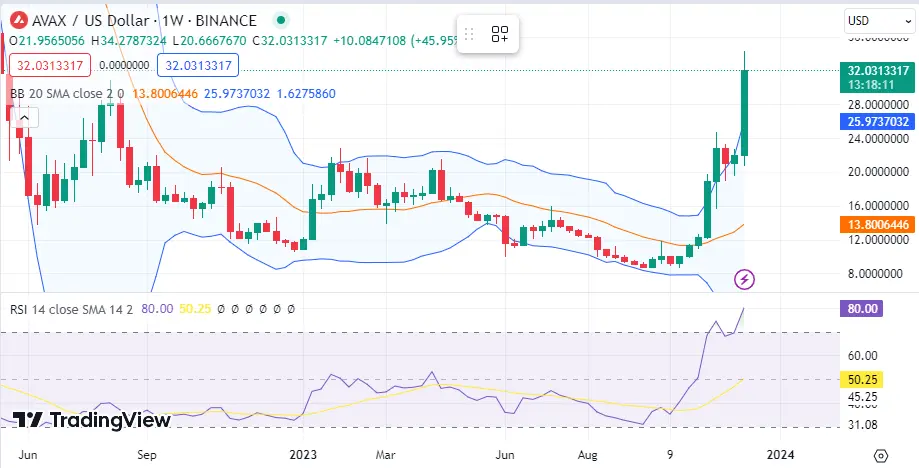 AVAX 1-day chart | Source: TradingView## Beam price analysis
Beam (BEAM) has seen bull activity this week, recording a weekly increase of 45% as the price is $0.01663. Helium has a market cap of $772M, and the trading volume stood at $113M as of press time.
Volatility on Beam price for the week has been rising as the Bollinger Bands diverge. BEAM’s relative strength indicator is above its average line, indicating bull dominance on Beam price over the week.
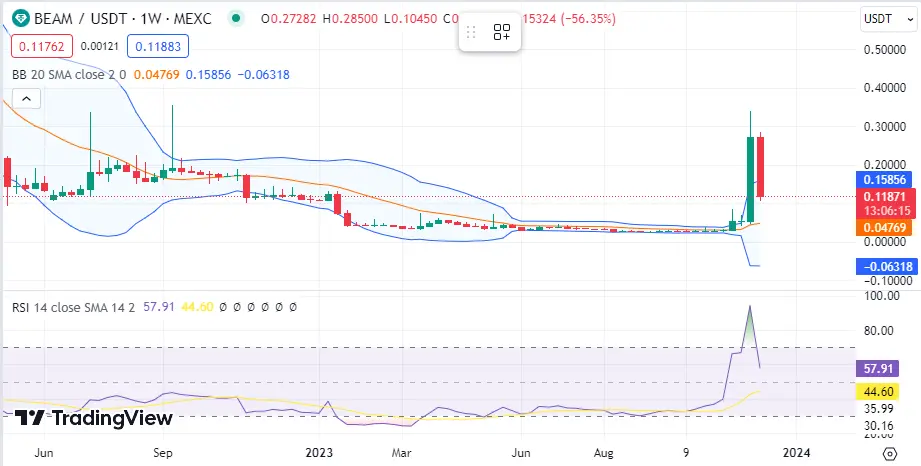 BEAM 1-day chart | Source: TradingView
免责声明:本页面信息可能来自第三方,不代表 Gate 的观点或意见。页面显示的内容仅供参考,不构成任何财务、投资或法律建议。Gate 对信息的准确性、完整性不作保证,对因使用本信息而产生的任何损失不承担责任。虚拟资产投资属高风险行为,价格波动剧烈,您可能损失全部投资本金。请充分了解相关风险,并根据自身财务状况和风险承受能力谨慎决策。具体内容详见声明。
评论
0/400
暂无评论