Ripple Explodes 11% Weekly But Bulls Must Now Focus on This Resistance (XRP Price Analysis)
In recent weeks, Ripple’s price has displayed an upward trend, recovering from a notable support level. However, there is still a crucial resistance level that must fall for the market to enter a bullish phase in the coming months.
Technical Analysis
By: Edris
XRP/USDT Daily Chart:
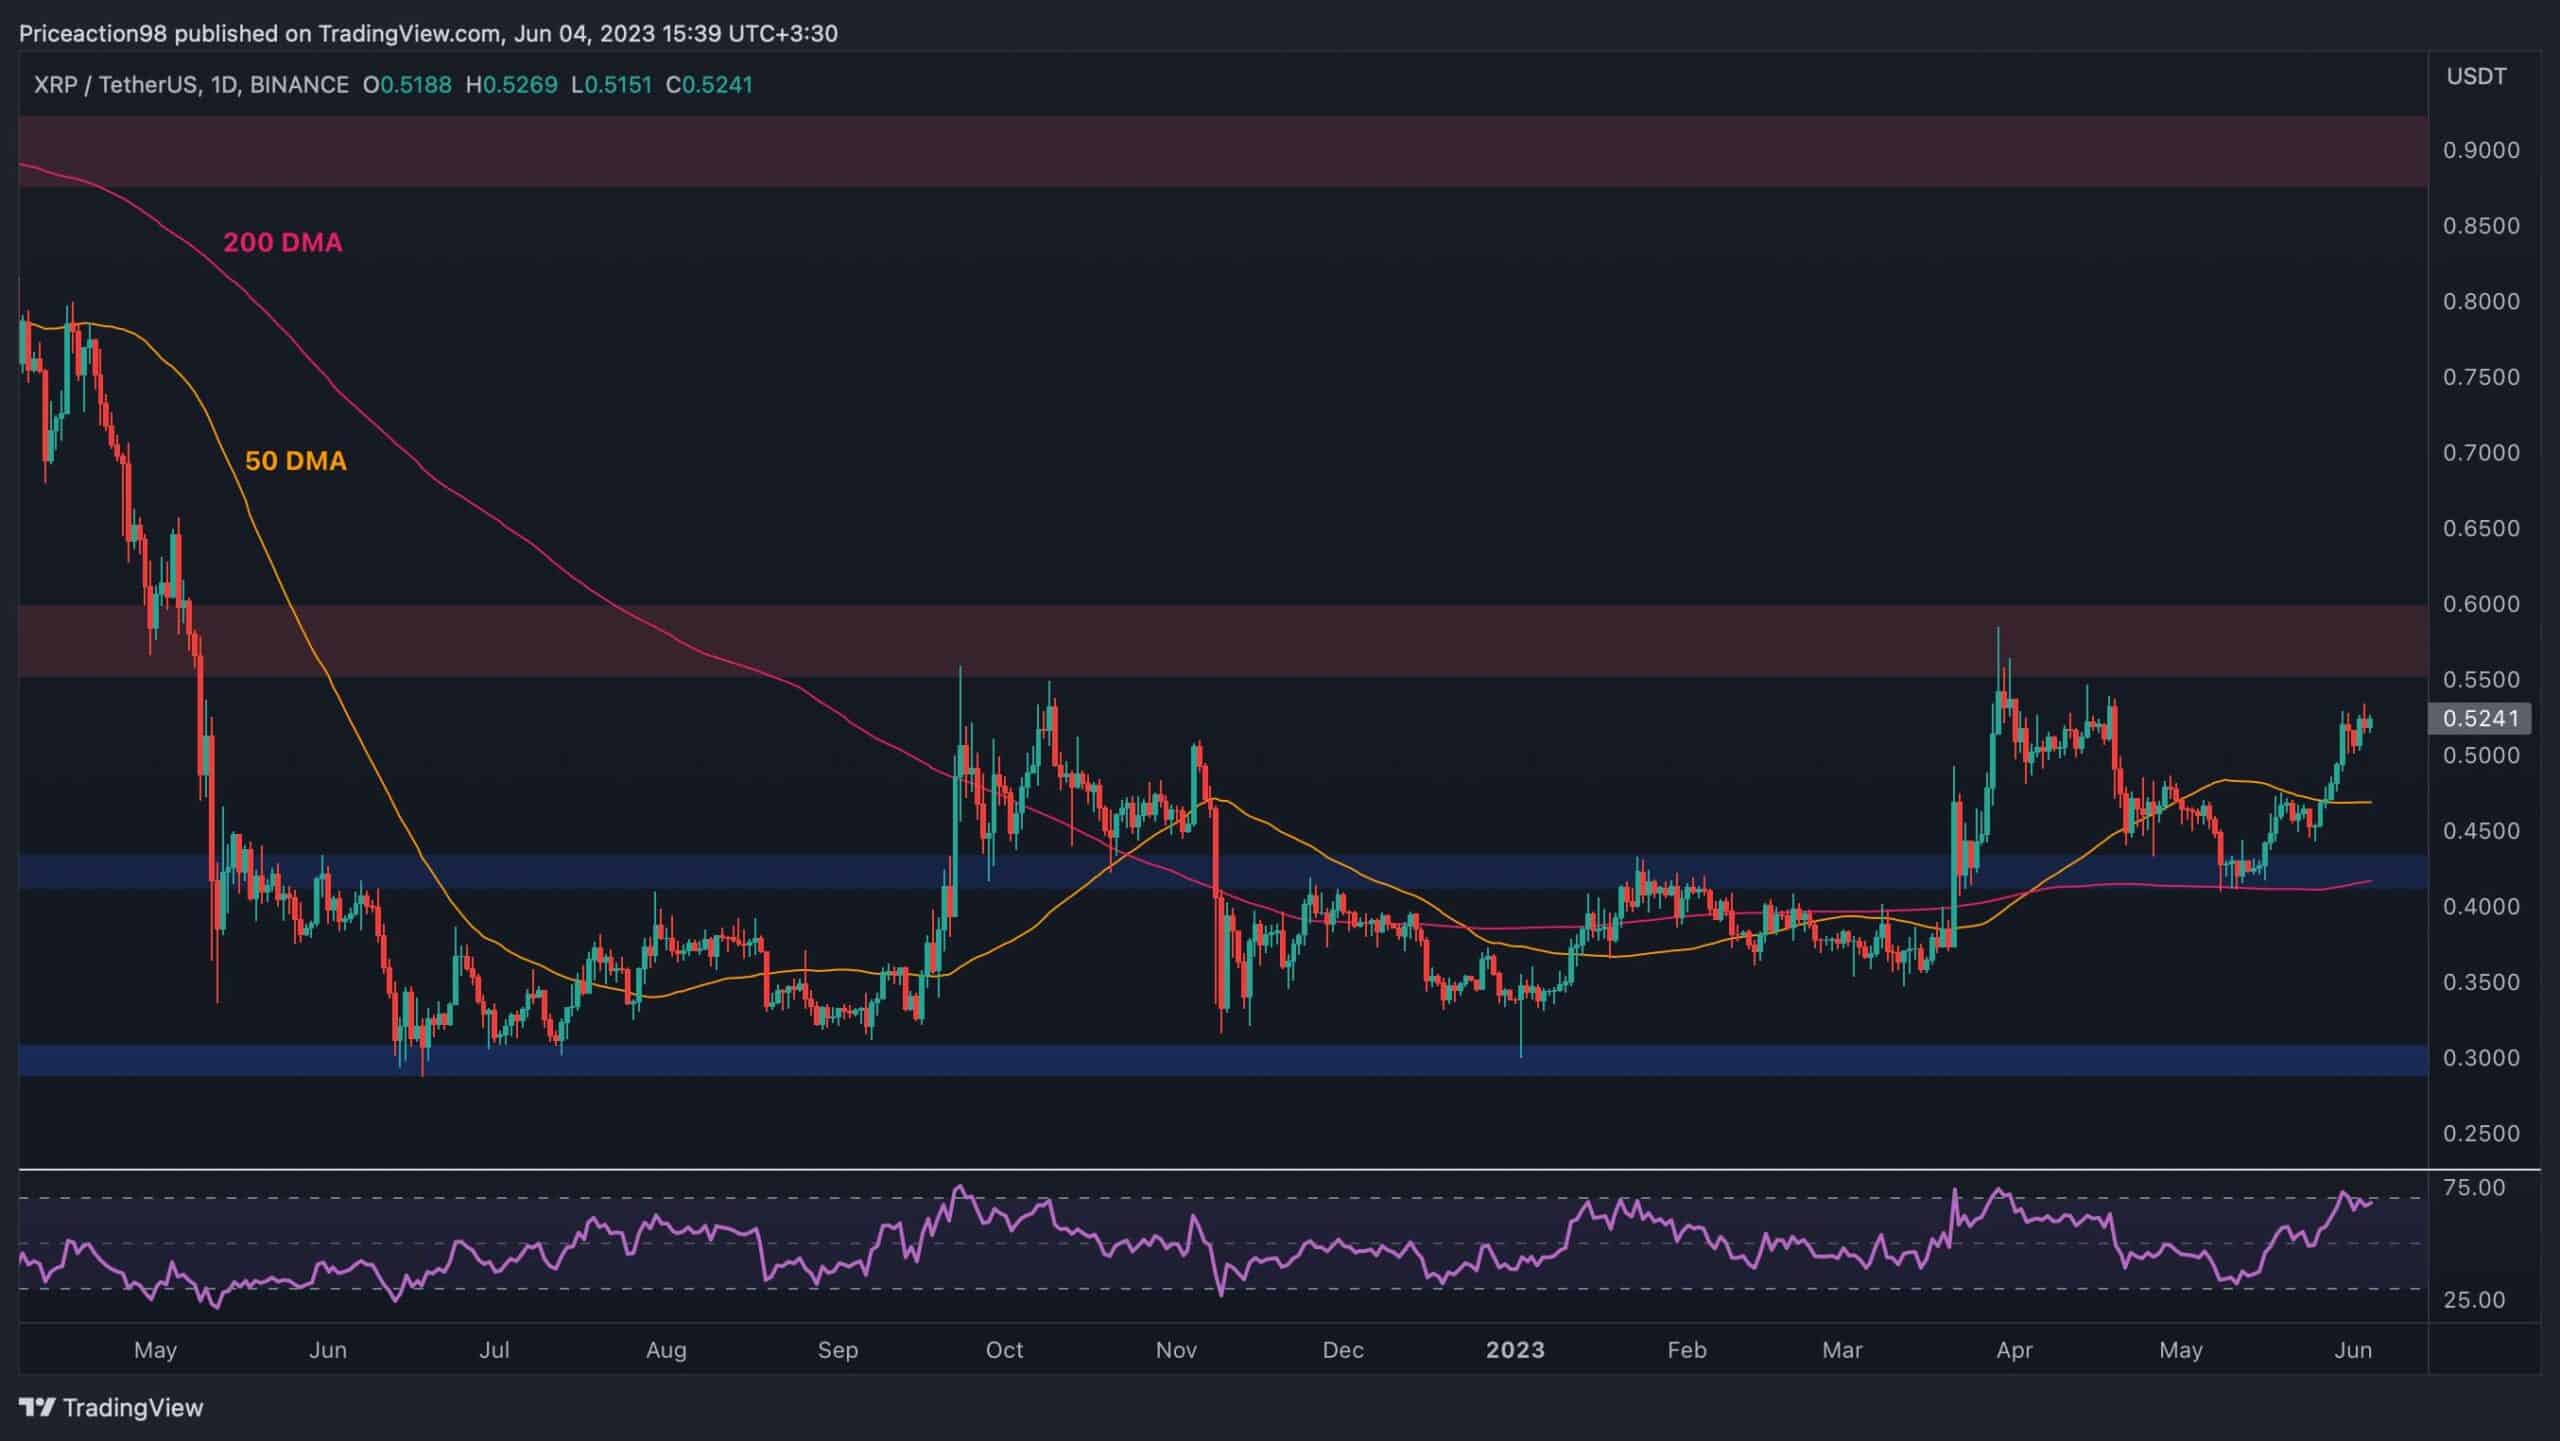
The XRP price has consistently increased after bouncing back from the $0.43 support. This level has also been reinforced by the 200-day moving average, while the price has surpassed the 50-day moving average at around $0.47.
Ripple is currently approaching the $0.6 resistance level, and a successful breakthrough could trigger a potential rally toward $0.9 in the coming months. However, it’s worth noting that the RSI has entered the overbought zone, indicating a potential correction in the near future.
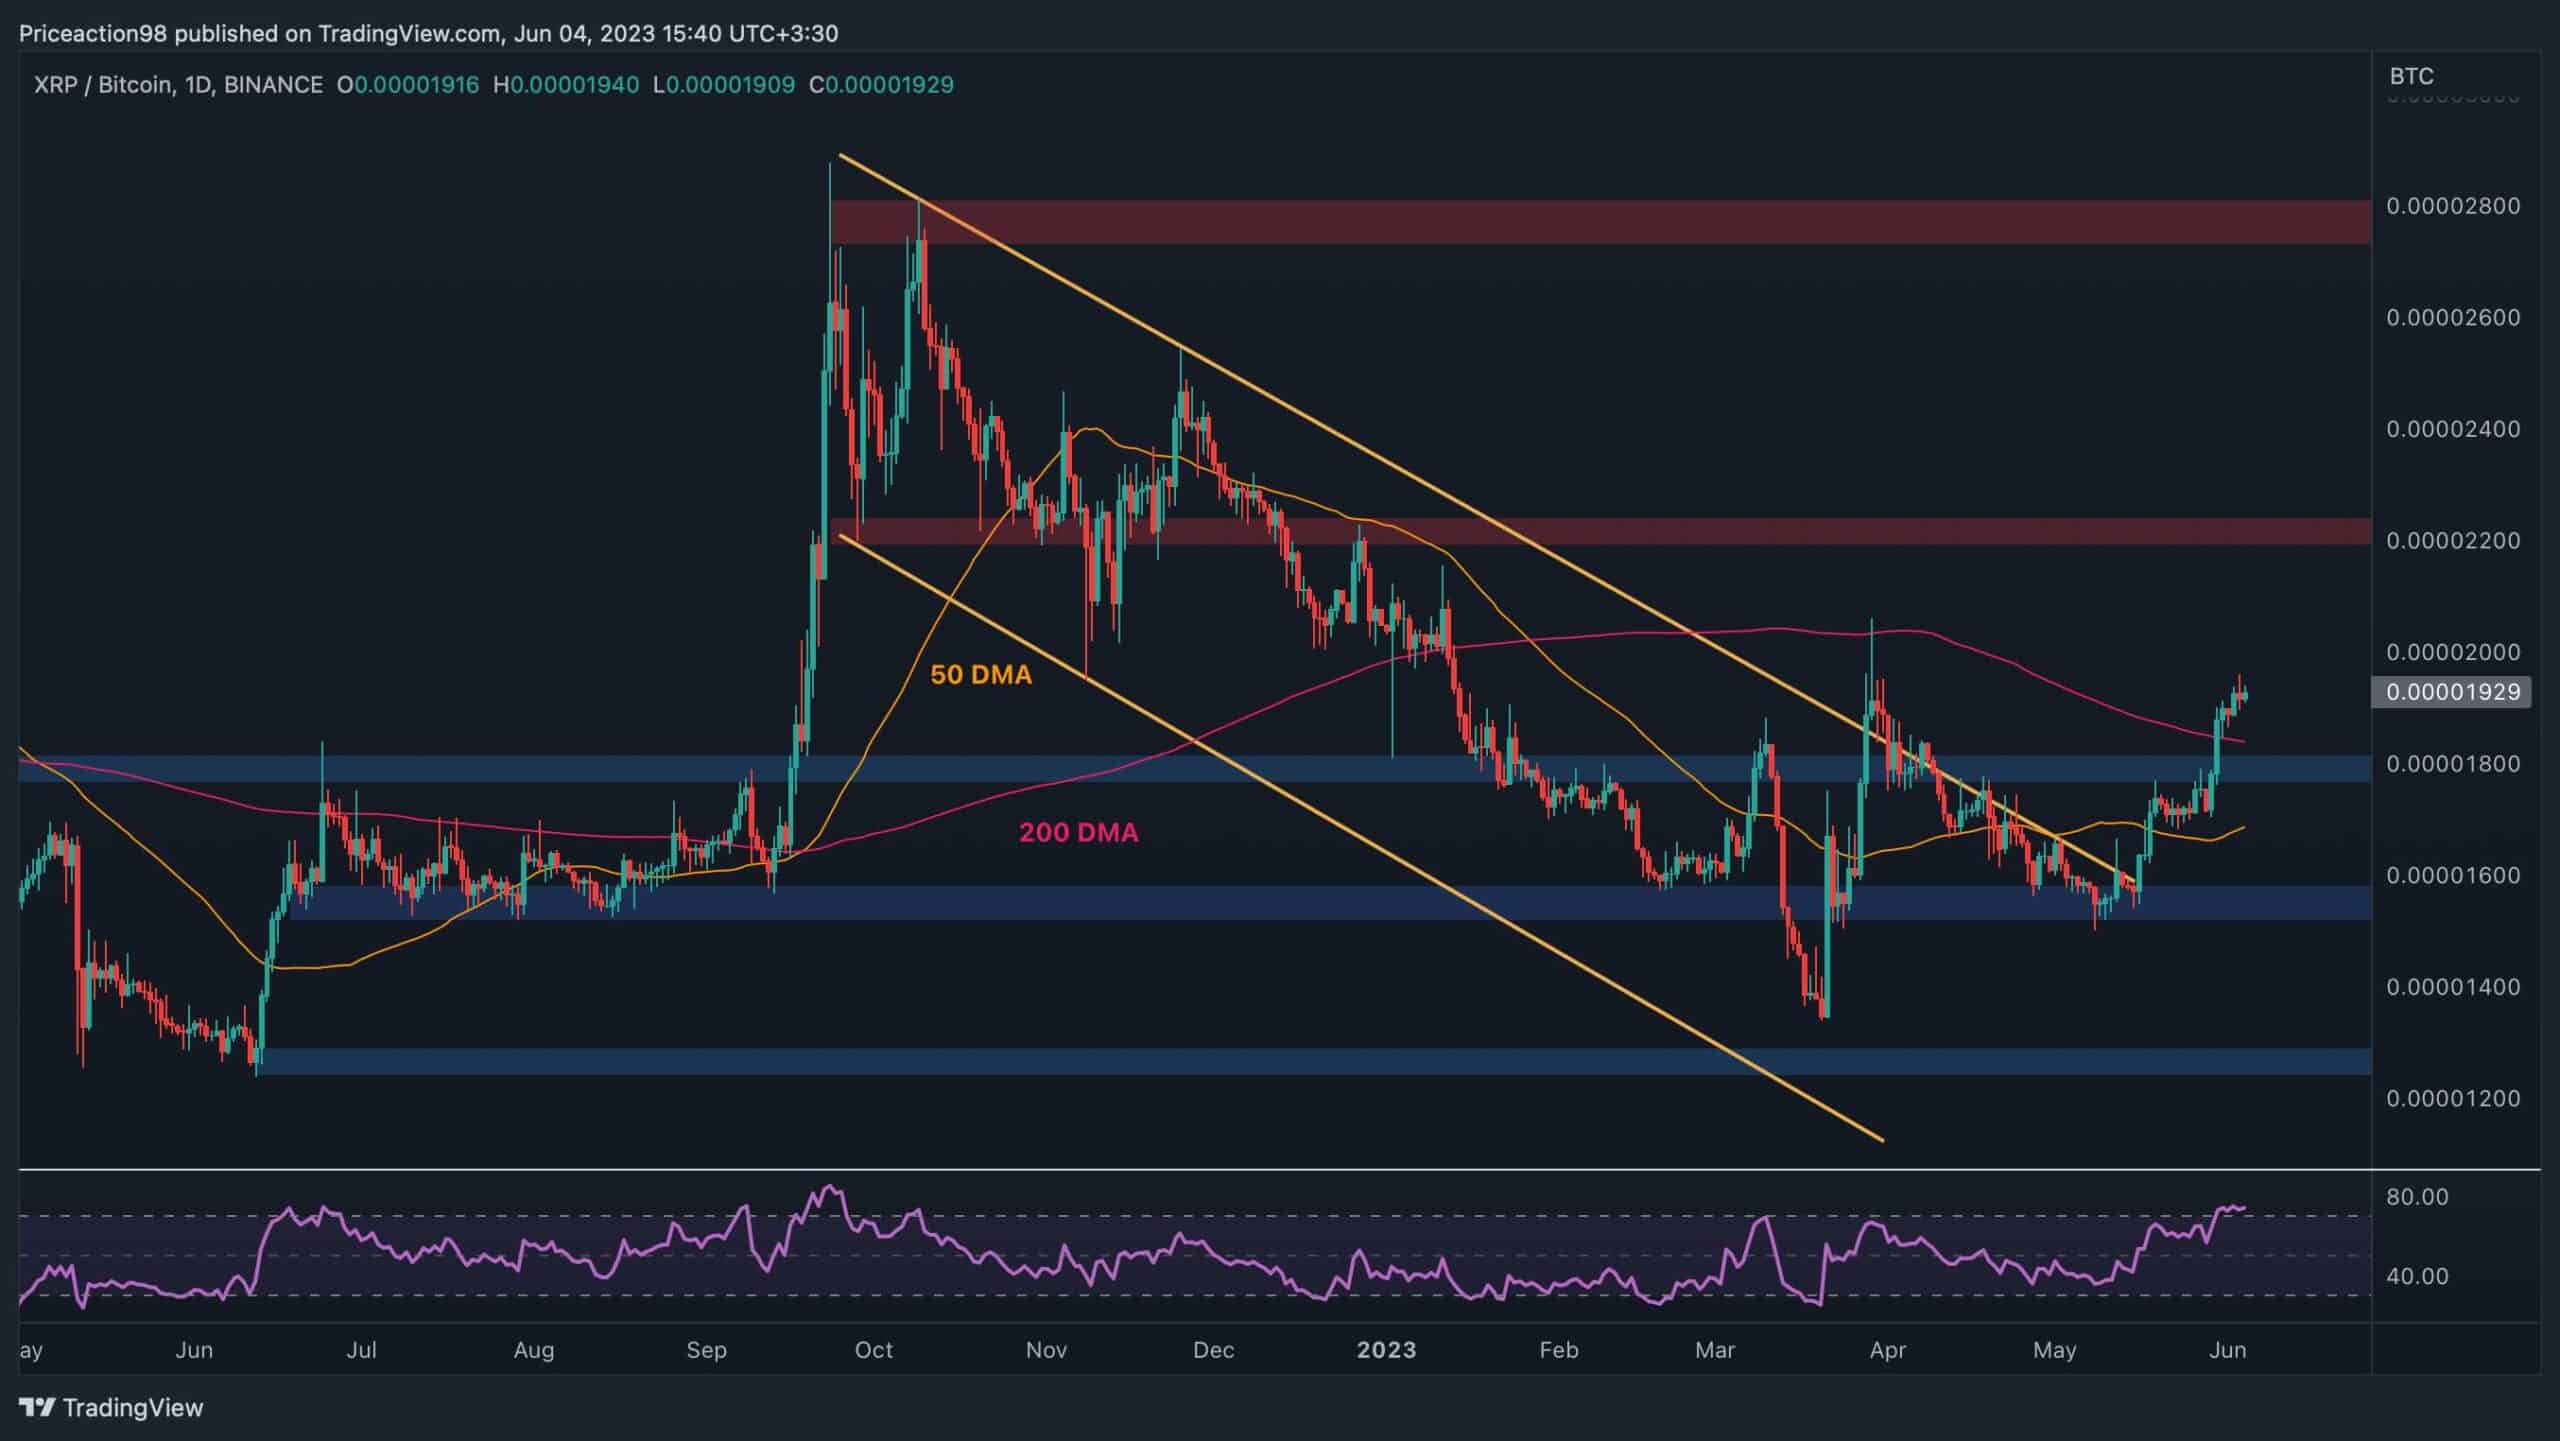
Looking at the BTC paired chart, there is a notable upward trend after the price successfully broke out of the significant descending channel. The 0.000017 SAT and 0.000019 SAT levels, representing the 50-day and 200-day moving averages, respectively, have both been surpassed, indicating positive momentum.
Currently, the Ripple price is approaching the psychological resistance level at 0.00002 SAT. However, it is important to note that the RSI indicator is signaling overbought conditions, implying a potential correction in the near term prior to any further upward movement.