#GateSquareAprilPostingChallenge #BTCMarketAnalysis BITCOIN MARKET ANALYSIS — APRIL 6, 2026
Every Angle. Every Point of View. Everything You Need to Know.
CURRENT SNAPSHOT
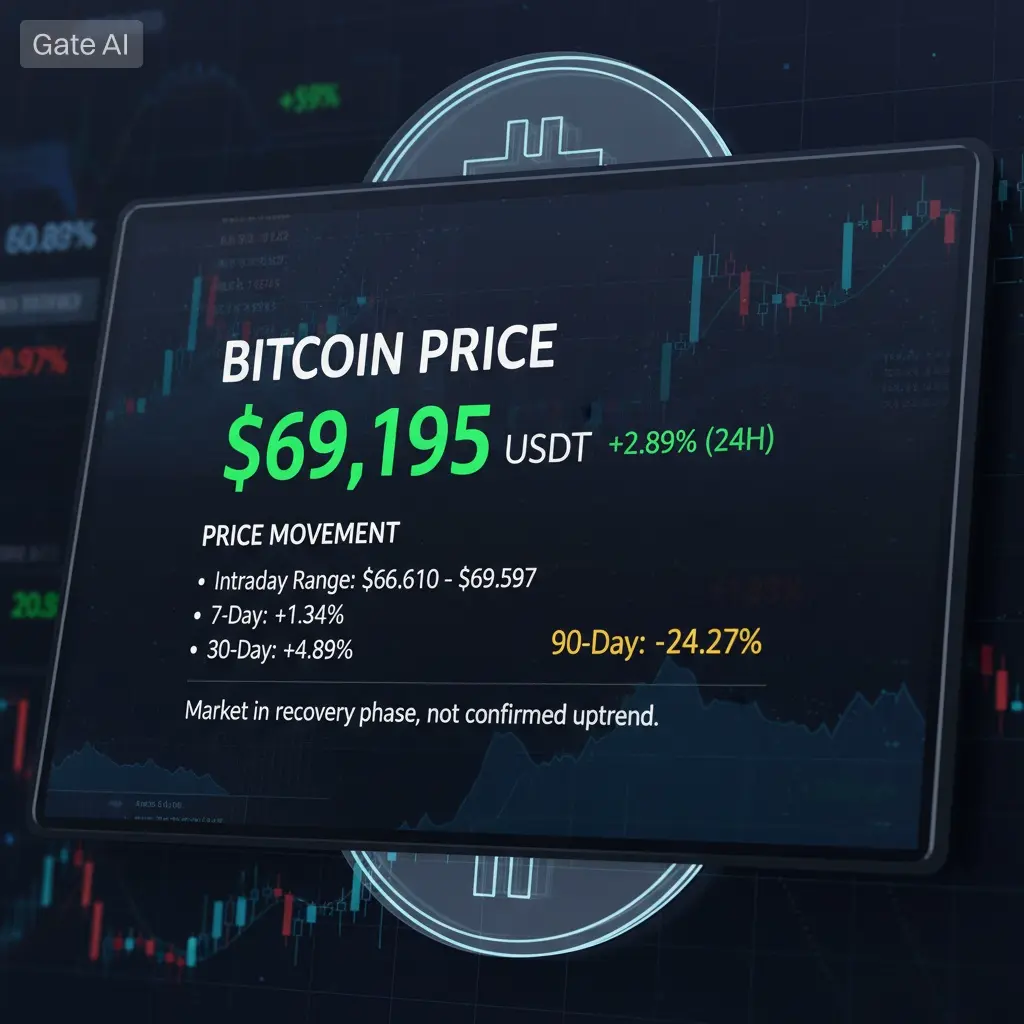
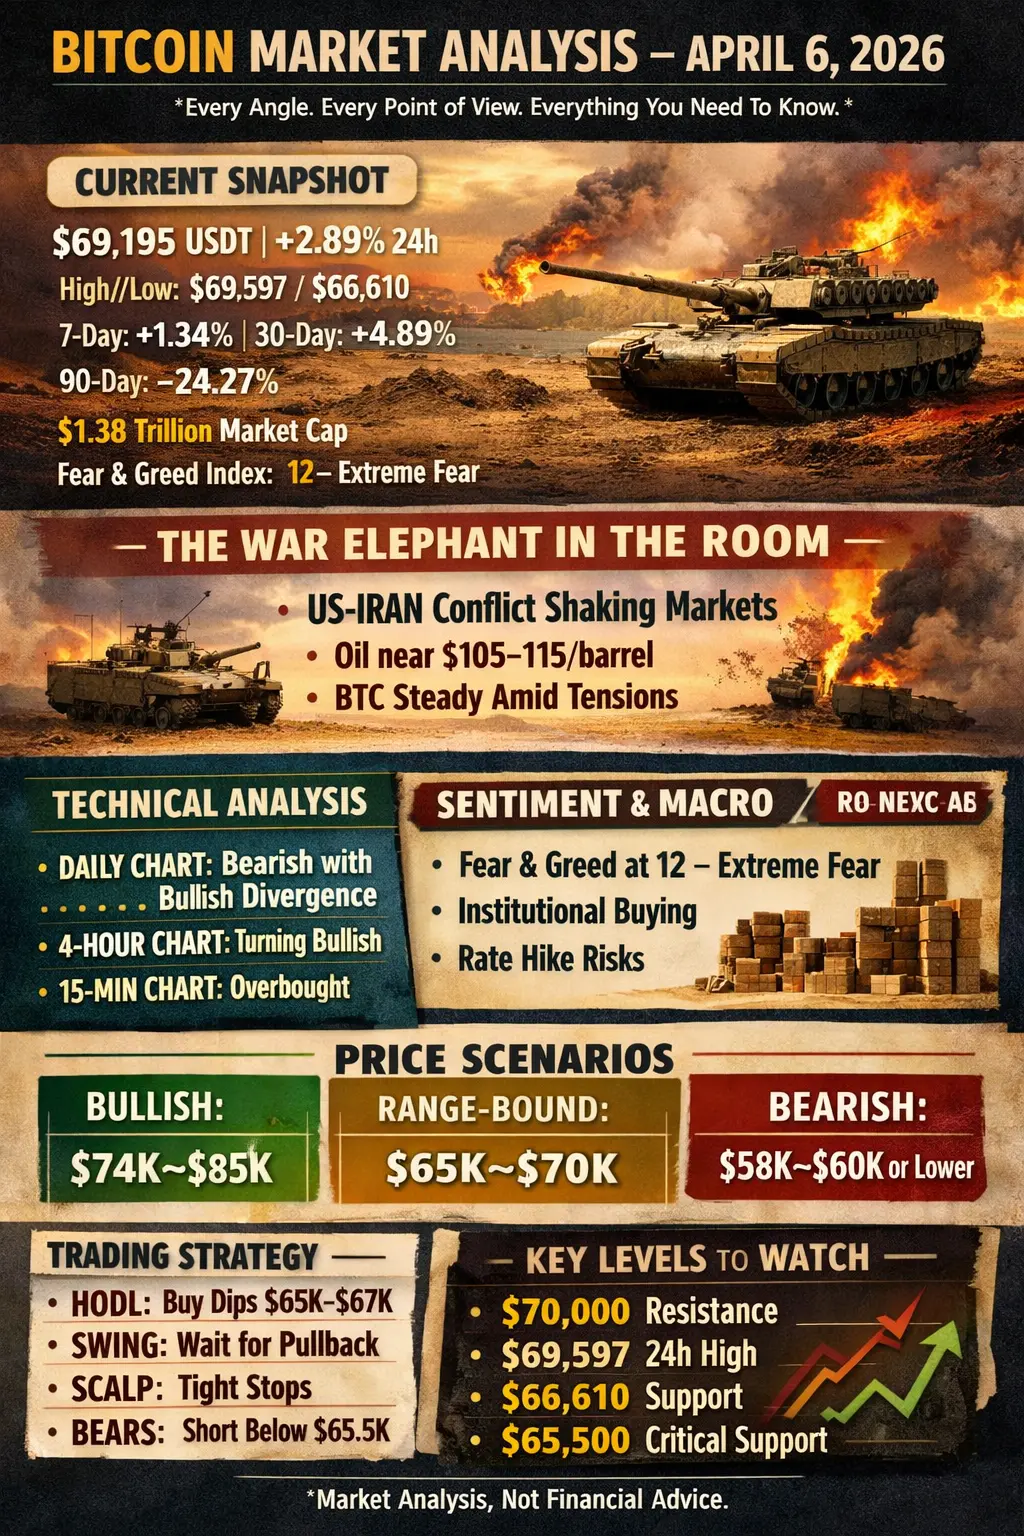
Bitcoin is currently trading at $69,195 USDT, showing a +2.89% gain in the last 24 hours, with an intraday range between $66,610 and $69,597. Over the past 7 days, price is up +1.34%, and over 30 days it has gained +4.89%, but zooming out, the 90-day performance still reflects a -24.27% decline, reminding us that the broader market is still in a recovery phase rather than a confirmed uptrend. The total market capitalization stands near $1.38 trillion, while sentiment remains extremely suppressed, with the Fear & Greed Index sitting at 12 — Extreme Fear, a level historically associated with panic-driven selling and long-term opportunity zones.
PART 1: THE WAR ELEPHANT IN THE ROOM — US-IRAN CONFLICT
Right now, the market is not moving on technicals alone — it is reacting to geopolitics in real time. The escalation between the US and Iran in late March and early April 2026 has become the dominant macro force shaping all risk assets, including Bitcoin. Military actions, direct ultimatums, and the threat of prolonged conflict pushed oil prices sharply higher, with WTI moving into the $105–115 range and Brent peaking above $112, triggering inflation fears and a broad risk-off environment across global markets.
The real pressure point has been the Strait of Hormuz, a critical artery for global oil supply. Any disruption here creates immediate panic across financial systems. And yet, despite all this, Bitcoin did not collapse — it stabilized and even rebounded. That raises the key question: why?
The answer lies in three converging forces. First, de-escalation signals from Iran, particularly coordination efforts with Oman to manage Strait traffic, provided immediate relief to markets. In a headline-driven environment, even a single sign of reduced tension can flip sentiment quickly, and Bitcoin responded by recovering losses and stabilizing within a single session.
Second, Bitcoin has started to show relative strength compared to traditional markets. While equities have faced deeper drawdowns, Bitcoin has remained relatively stable, reinforcing its evolving narrative as a non-sovereign, resilient asset — not fully risk-on, not fully risk-off, but something in between.
Third, and most importantly, institutional accumulation has not slowed down. Large players continue to buy regardless of short-term volatility. This creates a structural floor under price action that did not exist in previous cycles. While retail reacts emotionally, institutions are positioning strategically.
PART 2: TECHNICAL ANALYSIS — EVERY TIMEFRAME (FULLY INTEGRATED)
From a technical perspective, the market is in a transition phase — not fully bullish, not fully bearish, but shifting.
On the daily timeframe, the structure still reflects a bearish alignment, with shorter-term moving averages positioned below longer-term ones, indicating that the broader trend has not fully reversed yet. However, the underlying signals tell a more nuanced story. The SAR indicator has moved below the price, suggesting emerging support, while the recent low at $66,610 acts as a key defensive level for bulls.
More importantly, both RSI and MACD are showing bullish divergence. Price made a lower low, but momentum indicators did not follow — a classic signal that selling pressure is weakening. This does not guarantee an immediate rally, but it strongly suggests that the downside momentum is fading and a base is forming.
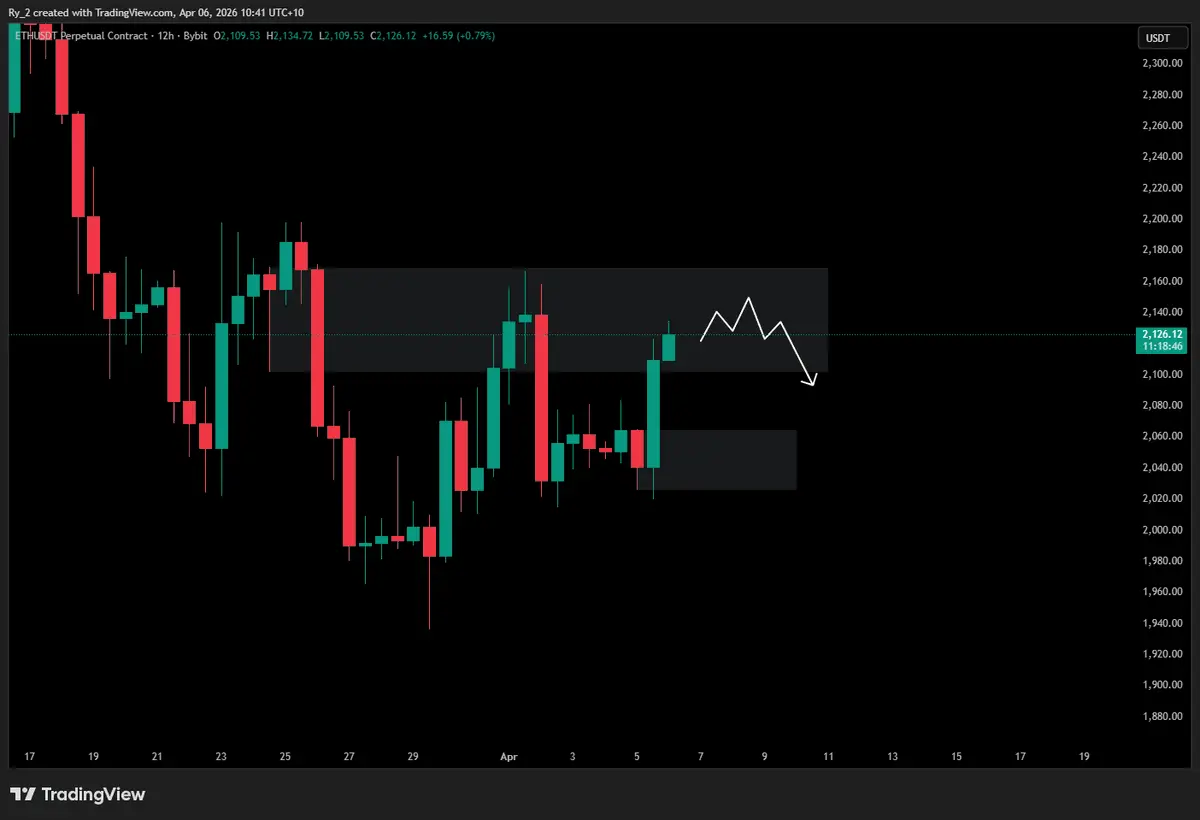
Shifting to the 4-hour timeframe, momentum is clearly improving. A golden cross has formed, with shorter-term averages crossing above longer ones, indicating a shift toward bullish momentum in the medium term. However, this move has come with overheating signals — CCI is elevated and Williams %R is near extreme levels, meaning the market is stretched in the short term and likely needs a pause or pullback before continuing higher.
On the 15-minute timeframe, the trend is fully bullish, with all moving averages aligned upward. However, this strength comes at a cost — RSI is sitting at 84.8, clearly in overbought territory. The SAR has started to flip above candles, signaling that short-term momentum may be cooling. This is not a reversal signal yet, but it is a warning that chasing price at this level carries risk.
Putting all timeframes together, the message is clear: the macro structure is still healing, the medium-term trend is turning bullish, and the short-term is overheated. This is a recovery phase — not yet a confirmed breakout cycle.
PART 3: SENTIMENT — WHAT THE MARKET FEELS
Despite the price holding near $69,195, sentiment remains deeply negative. The Fear & Greed Index at 12 reflects extreme caution, even panic. Historically, such levels have marked accumulation zones rather than exit points.
Interestingly, social sentiment shows a mixed but slightly bullish bias, with more bullish commentary than bearish. However, bearish narratives have intensified recently, reaching multi-week highs — which, from a contrarian perspective, often precedes upward moves due to short squeezes and positioning imbalances.
At the same time, overall social volume has dropped significantly, indicating that the market is entering a quieter phase. Less noise often precedes larger moves, as attention fades just before volatility returns.
The key takeaway here is simple: emotionally, the market is fearful — structurally, it is stabilizing.
PART 4: MACRO BACKDROP
The macro environment remains complex and somewhat contradictory. On one side, the ongoing conflict and elevated oil prices are inflationary, reducing the likelihood of near-term rate cuts and applying pressure to risk assets. On the other side, institutional demand for Bitcoin continues to grow, independent of short-term monetary policy.
ETF flows remain supportive, regulatory developments are gradually improving clarity, and long-term capital is entering the space with multi-year horizons. This creates a situation where short-term macro pressure coexists with long-term structural strength.
PART 5: PRICE SCENARIOS — WHERE BTC CAN GO
If bullish momentum continues and geopolitical tensions ease, the immediate resistance sits at $69,597, followed by the psychological barrier at $70,000. A clean break above this region could open a move toward $74,000–$76,000, and in a stronger relief rally scenario, even $80,000–$85,000 becomes possible.
In a more neutral scenario where uncertainty persists, Bitcoin is likely to remain range-bound between $65,000 and $70,000, with sharp but short-lived moves driven by headlines rather than sustained trends.
On the downside, if tensions escalate significantly and oil spikes further, a breakdown below $65,500 could lead to a retest of $58,000–$60,000, with extreme scenarios extending even lower. While this is not the base case, it remains a risk that cannot be ignored.
PART 6: TRADING STRATEGY — REAL EXECUTION PLAN
For long-term holders, the broader thesis remains intact. Extreme Fear, continued accumulation, and improving structural fundamentals all support gradual positioning rather than panic selling. Zones around $65,000–$67,000 remain attractive for accumulation.
For swing traders, patience is key. While the 4-hour trend has turned bullish, short-term indicators suggest waiting for a pullback instead of entering at $69,195. A retracement toward $66,500–$67,500 offers a more favorable risk-reward, targeting a move back toward $70,000–$71,000, with risk defined below $65,500.
For short-term traders, the market is currently extended. Overbought conditions mean entries should be timed carefully, ideally after a cooldown toward $68,000–$68,500, with tight risk management due to headline-driven volatility.
For bears, caution is critical. Shorting in an environment of institutional accumulation and extreme fear is inherently risky. Any short positions should only be considered on confirmed breakdowns below $65,500, not within the current range.
PART 7: KEY LEVELS TO WATCH (IN CONTEXT)
Right now, $70,000 remains the major psychological barrier, while $69,597 is the immediate resistance level. On the downside, $67,893 acts as near-term support, followed by the critical level at $66,610, which represents the recent low and structural support. A break below $65,500 would shift the market back toward a bearish trajectory, opening the door to $63,000 and potentially $58,000–$60,000.
BOTTOM LINE — THE ONE PARAGRAPH SUMMARY
Bitcoin is holding remarkably well at $69,195 in the middle of geopolitical instability, showing resilience that challenges its traditional classification as a pure risk asset. While the daily trend is still technically bearish, momentum indicators clearly signal that selling pressure is fading. Medium-term structure is turning bullish, but short-term conditions are overheated, suggesting a pause before continuation. Institutional accumulation continues to provide a strong underlying bid, while sentiment remains deeply fearful — a combination that historically favors upside over time. The key driver remains geopolitics: any de-escalation could unlock a move above $70,000 toward $74,000–$76,000, while escalation risks a breakdown below $65,500. Until clarity emerges, this remains a range-bound, headline-driven market where discipline, patience, and risk management matter more than prediction.
This is market analysis, not financial advice. Always manage risk and position size accordingly.