#BitcoinMarketAnalysis Strategic Equilibrium: February 2026 Structural Reset Phase
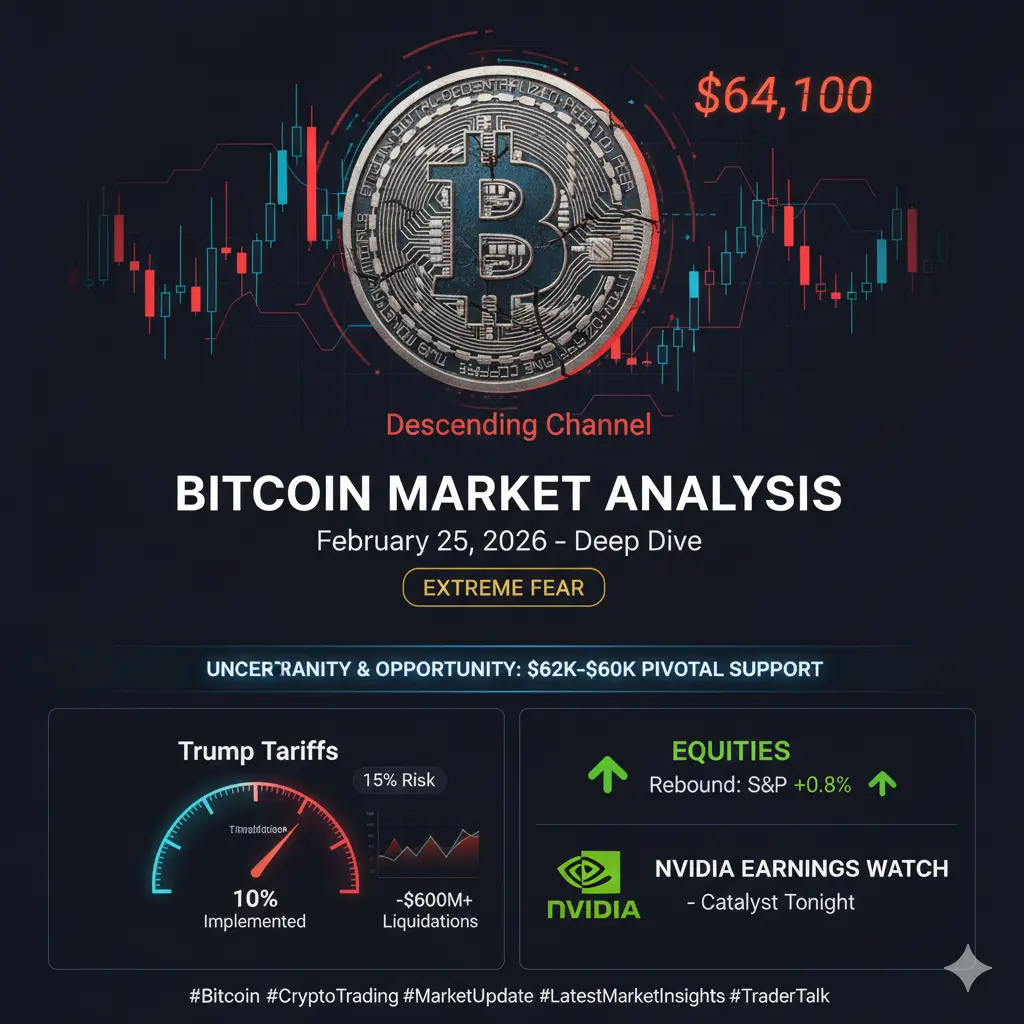
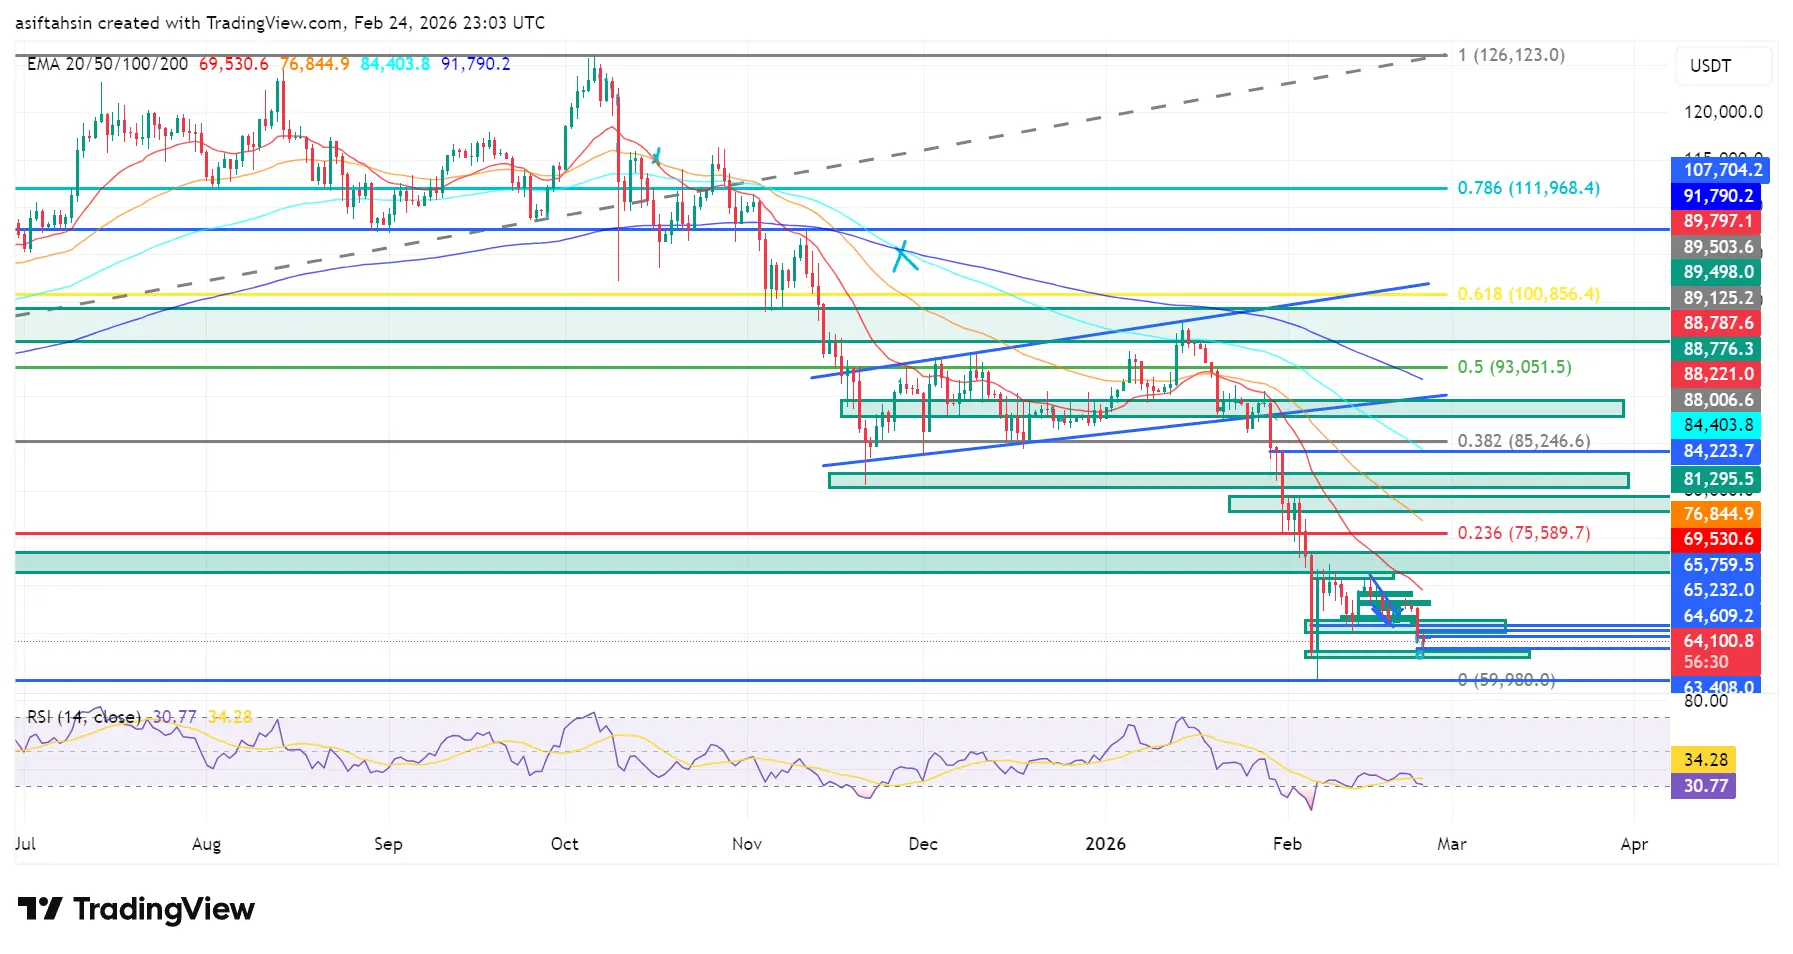
As February 2026 enters its final stretch, Bitcoin remains locked in a strategic equilibrium zone between $63,000 and $64,000. This range is no longer just a price consolidation — it represents a macro-technical compression phase where liquidity, sentiment, and positioning are recalibrating after the 2025 expansion cycle.
Markets are no longer reacting purely to crypto-native catalysts. Instead, Bitcoin is being evaluated within a broader cross-asset framework shaped by shifting dollar strength, bond yield dynamics, and global growth expectations. The current structure reflects balance — not weakness — but balance under pressure.
Macroeconomic Context: Liquidity vs. Risk Appetite
Recent failures to sustain price above $64,000 are not purely technical rejections. They reflect macro headwinds:
Slowing technology sector momentum globally
Stronger short-term U.S. dollar positioning
Elevated bond yields limiting speculative capital
Ongoing trade policy uncertainty
When macro uncertainty rises, capital preservation becomes dominant. High-beta assets typically experience compression before renewed expansion. Bitcoin, while increasingly institutionalized, still reacts to global liquidity conditions before decoupling narratives can form.
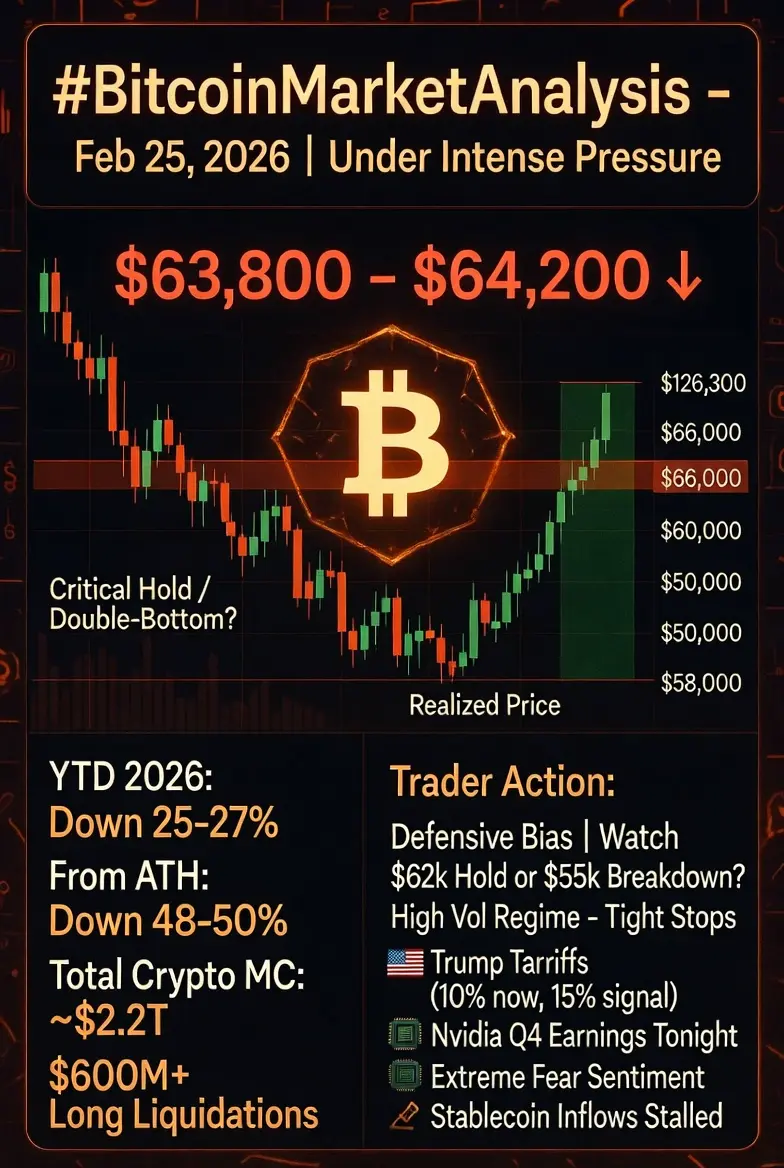
The broader crypto market cap hovering near $2.2 trillion suggests valuation compression, but not structural breakdown. Meanwhile, Ethereum testing the $1,800 support level adds indirect pressure to overall sentiment, as ETH often serves as the risk barometer for the altcoin complex.
Historically, these contraction phases function as leverage-clearing events rather than trend-ending reversals.
Technical Structure: Compression Before Expansion?
Several technical signals suggest we are in late-stage consolidation rather than early-stage breakdown:
1. Volatility Compression
Realized volatility is near levels last observed during the late 2022 accumulation zone. Periods of extreme compression typically precede directional expansion. The market is storing energy.
2. RSI Positioning
Daily RSI remains in oversold-to-neutral territory despite sideways price action. This divergence indicates seller exhaustion rather than aggressive distribution.
3. Realized Price Framework
Bitcoin is currently trading:
Above a realized holder cost basis near $55,000
Below a broader market cost average around $79,000
This positioning suggests long-term holders remain profitable and structurally supportive, while shorter-term participants are cautious.
On-Chain & Structural Health
The divergence between price stagnation and network strength is one of the most notable features of this cycle:
Hash rate remains at record highs
Miner capitulation signals are minimal
Exchange balances continue trending structurally lower
Long-term holder supply remains elevated
Network fundamentals do not reflect distribution pressure. Instead, they reflect resilience beneath a cooling price surface.
Additionally, power-law deviation models tracking approximately 25–30% below historical cycle averages indicate valuation compression relative to prior speculative peaks. This gap often closes through gradual appreciation rather than vertical spikes.
Institutional Flow & ETF Dynamics
Spot ETF inflows have slowed compared to peak 2025 levels, but they have not reversed aggressively. This suggests:
Institutional participants are pausing — not exiting
Reallocation decisions are macro-driven
Liquidity timing is being optimized rather than abandoned
If macro conditions stabilize, ETF inflows could reaccelerate quickly due to reduced overhead supply.
Key Levels: Decision Framework
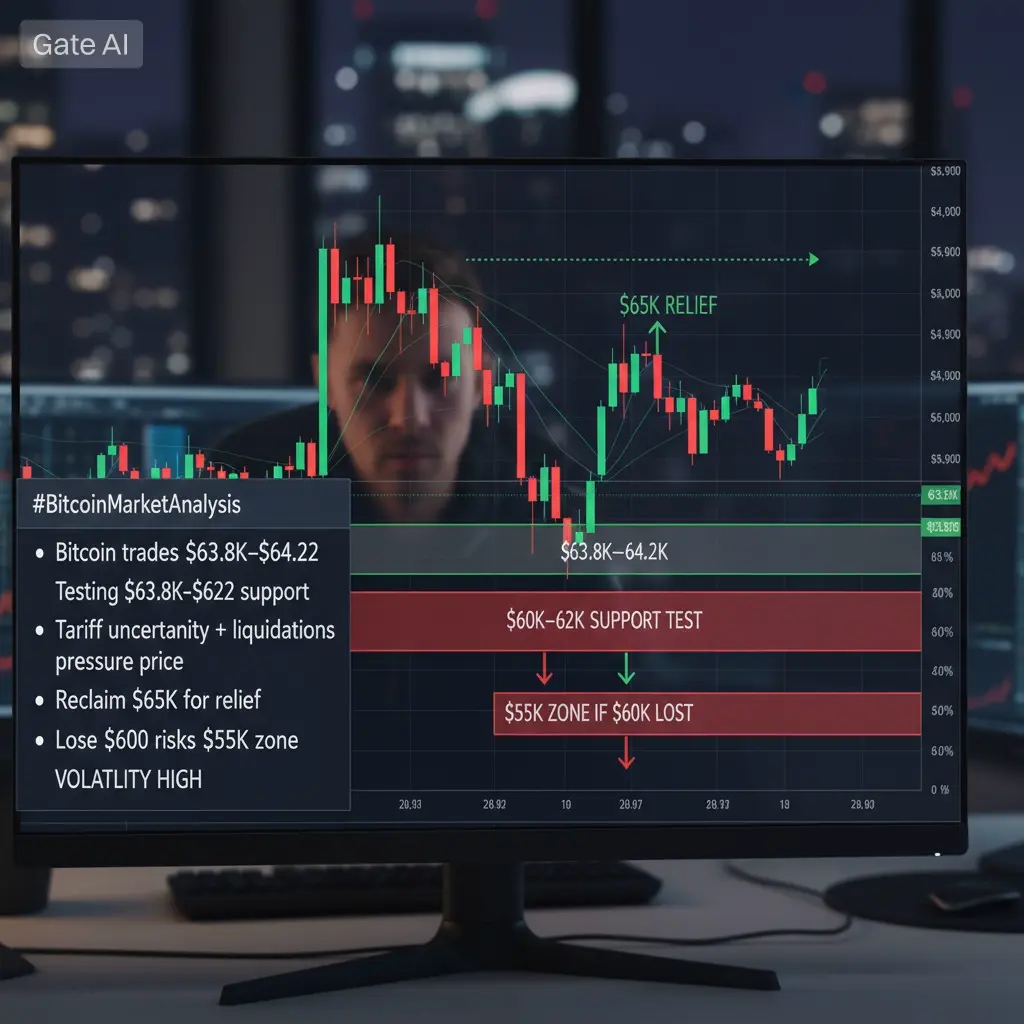
Primary Support: $60,000
This level serves as both psychological and structural defense. Holding above it preserves bullish medium-term structure.
Upside Trigger: Sustained Close Above $65,000
Would signal absorption of overhead liquidity and open a path toward $70,000–$72,000.
Downside Risk: Break Below $60,000
Could initiate a controlled retracement toward the $50,000–$54,000 liquidity pocket, where strong historical demand sits.
At present, there is no confirmed breakdown — only range-bound compression.
Liquidity & Derivatives Behavior
Open interest has shown expansion without sustained directional follow-through. This typically precedes one of two outcomes:
A liquidation sweep followed by trend continuation
A volatility breakout triggered by funding imbalance
Monitoring funding rate extremes and liquidation clusters near leveraged zones remains critical over the next 7–10 trading sessions.
Forward Projection: Late Q1 Outlook
Short-Term (1–2 Weeks):
Expect continued range-bound volatility between $60K–$66K with occasional liquidity wicks.
Medium-Term (1–2 Months):
Directional clarity will depend on:
U.S. dollar trajectory
Bond yield stability
Equity market resilience
ETF flow resumption
If macro stabilizes, Bitcoin’s structural underperformance relative to prior cycle averages may resolve through gradual upside expansion rather than explosive breakout.
Strategic Conclusion
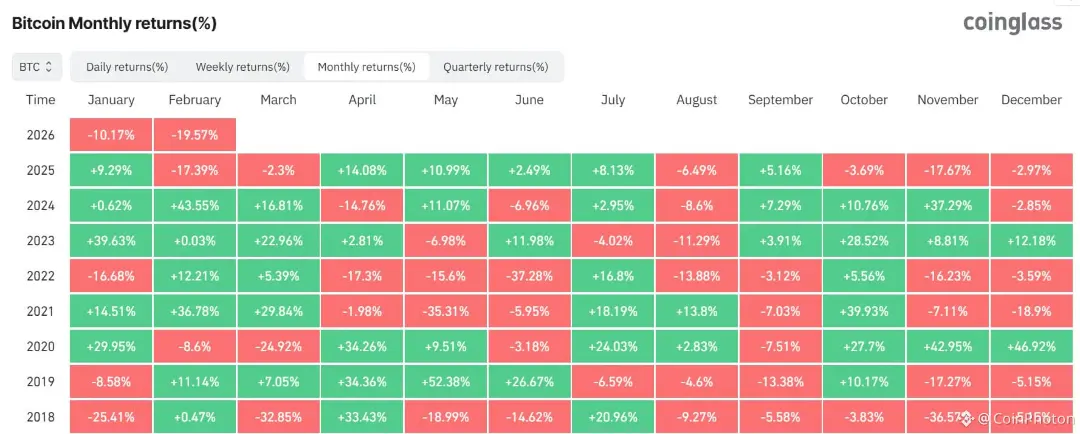
The February 2026 market is not signaling collapse — it is signaling recalibration. Sentiment is subdued, volatility is compressed, and leverage has normalized. These conditions historically precede structural continuation phases rather than terminal tops.
For disciplined participants, this phase demands patience and data alignment rather than emotional reaction. Equilibrium zones test conviction — but they also build the foundation for the next expansionary leg.
The market is not searching for excitement.
It is searching for confirmation.
As February 2026 enters its final stretch, Bitcoin remains locked in a strategic equilibrium zone between $63,000 and $64,000. This range is no longer just a price consolidation — it represents a macro-technical compression phase where liquidity, sentiment, and positioning are recalibrating after the 2025 expansion cycle.
Markets are no longer reacting purely to crypto-native catalysts. Instead, Bitcoin is being evaluated within a broader cross-asset framework shaped by shifting dollar strength, bond yield dynamics, and global growth expectations. The current structure reflects balance — not weakness — but balance under pressure.
Macroeconomic Context: Liquidity vs. Risk Appetite
Recent failures to sustain price above $64,000 are not purely technical rejections. They reflect macro headwinds:
Slowing technology sector momentum globally
Stronger short-term U.S. dollar positioning
Elevated bond yields limiting speculative capital
Ongoing trade policy uncertainty
When macro uncertainty rises, capital preservation becomes dominant. High-beta assets typically experience compression before renewed expansion. Bitcoin, while increasingly institutionalized, still reacts to global liquidity conditions before decoupling narratives can form.
The broader crypto market cap hovering near $2.2 trillion suggests valuation compression, but not structural breakdown. Meanwhile, Ethereum testing the $1,800 support level adds indirect pressure to overall sentiment, as ETH often serves as the risk barometer for the altcoin complex.
Historically, these contraction phases function as leverage-clearing events rather than trend-ending reversals.
Technical Structure: Compression Before Expansion?
Several technical signals suggest we are in late-stage consolidation rather than early-stage breakdown:
1. Volatility Compression
Realized volatility is near levels last observed during the late 2022 accumulation zone. Periods of extreme compression typically precede directional expansion. The market is storing energy.
2. RSI Positioning
Daily RSI remains in oversold-to-neutral territory despite sideways price action. This divergence indicates seller exhaustion rather than aggressive distribution.
3. Realized Price Framework
Bitcoin is currently trading:
Above a realized holder cost basis near $55,000
Below a broader market cost average around $79,000
This positioning suggests long-term holders remain profitable and structurally supportive, while shorter-term participants are cautious.
On-Chain & Structural Health
The divergence between price stagnation and network strength is one of the most notable features of this cycle:
Hash rate remains at record highs
Miner capitulation signals are minimal
Exchange balances continue trending structurally lower
Long-term holder supply remains elevated
Network fundamentals do not reflect distribution pressure. Instead, they reflect resilience beneath a cooling price surface.
Additionally, power-law deviation models tracking approximately 25–30% below historical cycle averages indicate valuation compression relative to prior speculative peaks. This gap often closes through gradual appreciation rather than vertical spikes.
Institutional Flow & ETF Dynamics
Spot ETF inflows have slowed compared to peak 2025 levels, but they have not reversed aggressively. This suggests:
Institutional participants are pausing — not exiting
Reallocation decisions are macro-driven
Liquidity timing is being optimized rather than abandoned
If macro conditions stabilize, ETF inflows could reaccelerate quickly due to reduced overhead supply.
Key Levels: Decision Framework
Primary Support: $60,000
This level serves as both psychological and structural defense. Holding above it preserves bullish medium-term structure.
Upside Trigger: Sustained Close Above $65,000
Would signal absorption of overhead liquidity and open a path toward $70,000–$72,000.
Downside Risk: Break Below $60,000
Could initiate a controlled retracement toward the $50,000–$54,000 liquidity pocket, where strong historical demand sits.
At present, there is no confirmed breakdown — only range-bound compression.
Liquidity & Derivatives Behavior
Open interest has shown expansion without sustained directional follow-through. This typically precedes one of two outcomes:
A liquidation sweep followed by trend continuation
A volatility breakout triggered by funding imbalance
Monitoring funding rate extremes and liquidation clusters near leveraged zones remains critical over the next 7–10 trading sessions.
Forward Projection: Late Q1 Outlook
Short-Term (1–2 Weeks):
Expect continued range-bound volatility between $60K–$66K with occasional liquidity wicks.
Medium-Term (1–2 Months):
Directional clarity will depend on:
U.S. dollar trajectory
Bond yield stability
Equity market resilience
ETF flow resumption
If macro stabilizes, Bitcoin’s structural underperformance relative to prior cycle averages may resolve through gradual upside expansion rather than explosive breakout.
Strategic Conclusion
The February 2026 market is not signaling collapse — it is signaling recalibration. Sentiment is subdued, volatility is compressed, and leverage has normalized. These conditions historically precede structural continuation phases rather than terminal tops.
For disciplined participants, this phase demands patience and data alignment rather than emotional reaction. Equilibrium zones test conviction — but they also build the foundation for the next expansionary leg.
The market is not searching for excitement.
It is searching for confirmation.