Trade
Basic
Futures
Futures
Hundreds of contracts settled in USDT or BTC
Options
HOT
Trade European-style vanilla options
Unified Account
Maximize your capital efficiency
Demo Trading
Futures Kickoff
Get prepared for your futures trading
Futures Events
Futures Mall
Participate in events to win generous rewards
Demo Trading
Use virtual funds to experience risk-free trading
Earn
Launch
CandyDrop
Collect candies to earn airdrops
Launchpool
Quick staking, earn potential new tokens
HODLer Airdrop
Hold GT and get massive airdrops for free
Launchpad
Be early to the next big token project
Alpha Points
NEW
Trade on-chain assets and enjoy airdrop rewards!
Futures Points
NEW
Earn futures points and claim airdrop rewards
Investment
Simple Earn
Earn interests with idle tokens
Auto-Invest
Auto-invest on a regular basis
Dual Investment
Buy low and sell high to take profits from price fluctuations
Soft Staking
Earn rewards with flexible staking
Crypto Loan
0 Fees
Pledge one crypto to borrow another
Lending Center
One-stop lending hub
VIP Wealth Hub
Customized wealth management empowers your assets growth
Private Wealth Management
Customized asset management to grow your digital assets
Quant Fund
Top asset management team helps you profit without hassle
Staking
Stake cryptos to earn in PoS products
Smart Leverage
NEW
No forced liquidation before maturity, worry-free leveraged gains
GUSD Minting
Use USDT/USDC to mint GUSD for treasury-level yields
More
# AVAUSDT
452
NaveedContrarian
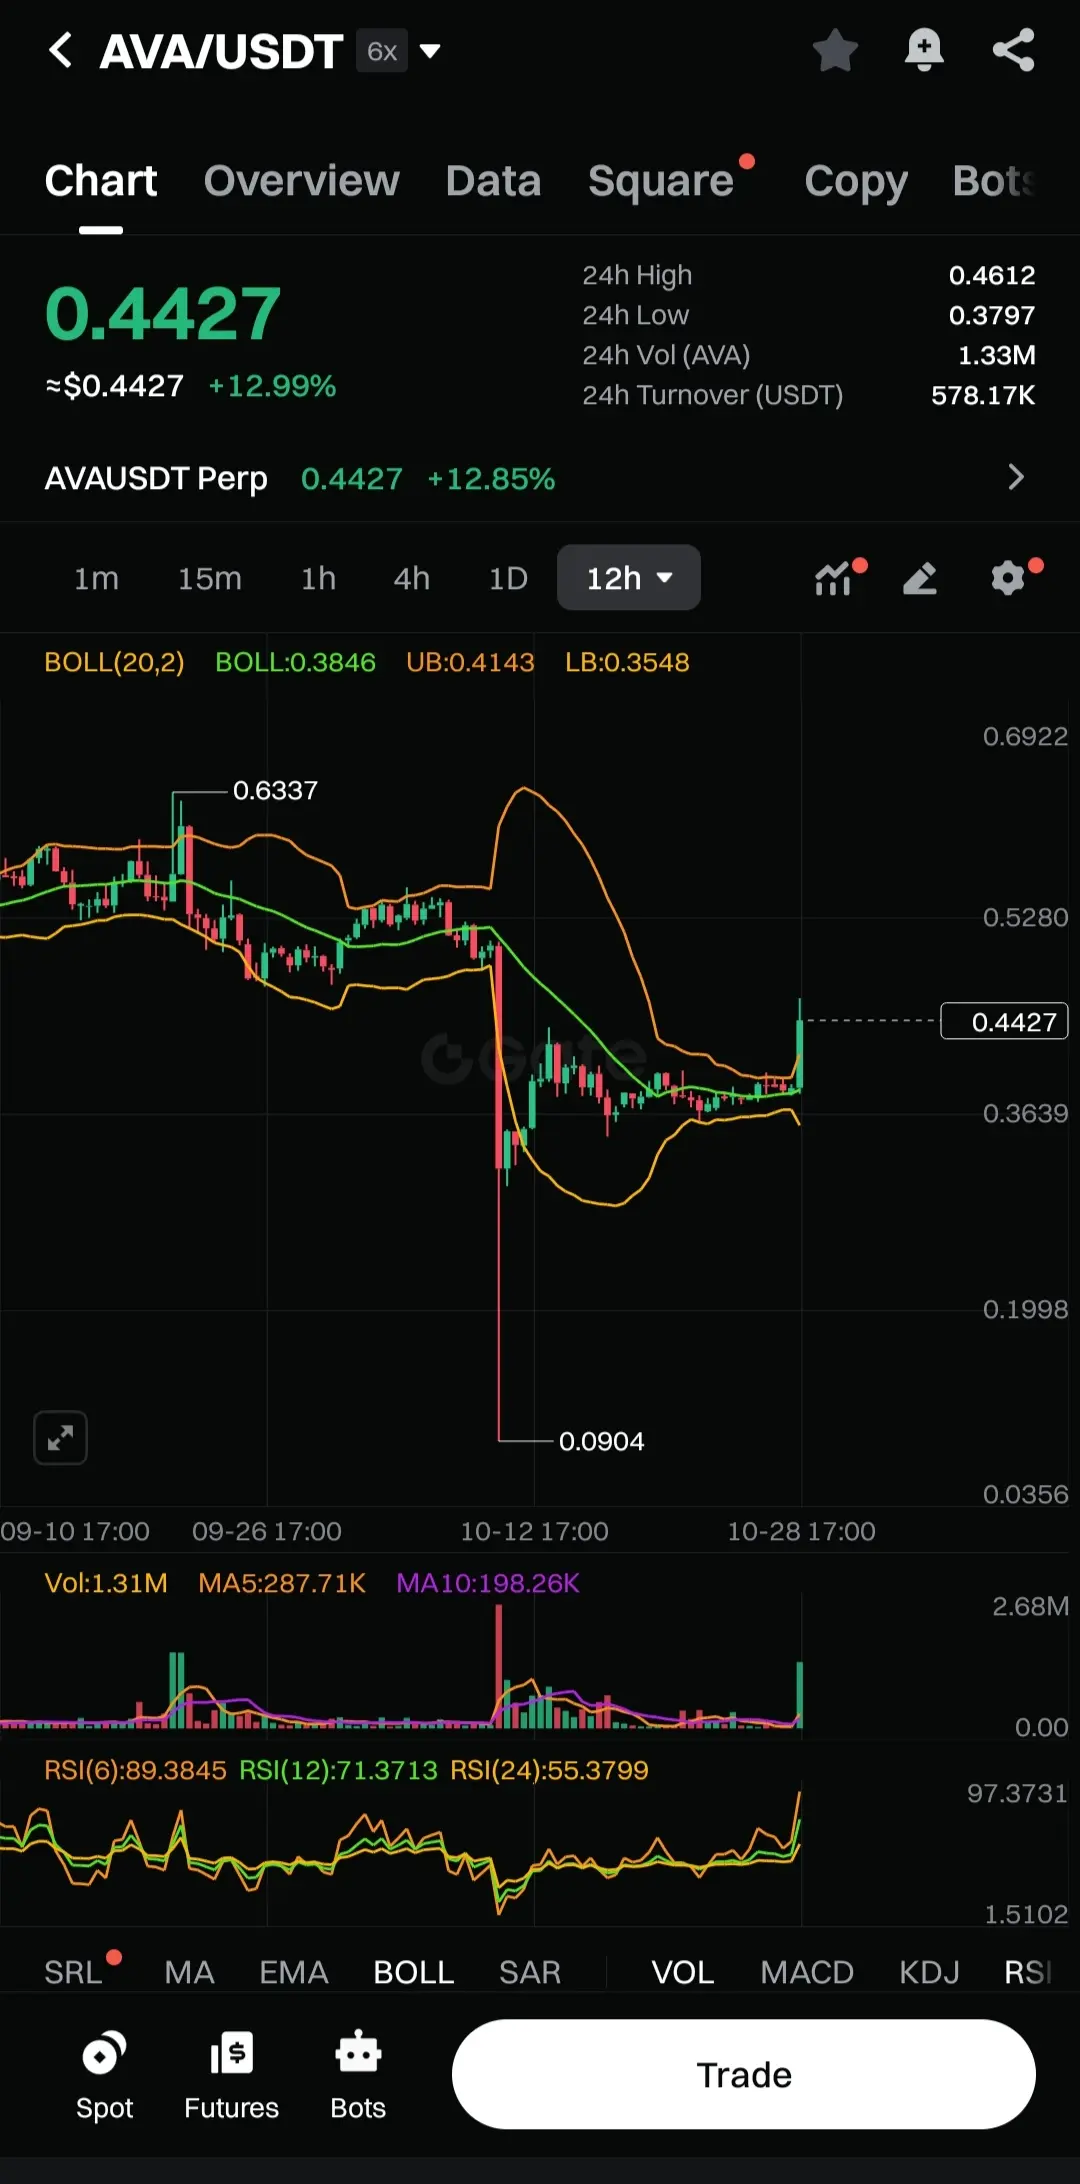
$AVA /USDT Technical Analysis: Bullish Reversal in Progress 📈
AVA demonstrates impressive recovery with +12.99% momentum, trading at $0.4427. The 12H chart reveals a textbook bullish reversal pattern.
Technical Breakdown:
📊 RSI Multi-Timeframe: RSI(6): 89.38, RSI(12): 71.37, RSI(24): 55.38 - Strong upward momentum across all periods
📈 Bollinger Bands (20,2): Price breaking above middle band (0.3846), targeting upper band at 0.4143 - expansion phase active
📉 Volume Analysis: 1.31M volume surge validates genuine accumulation, with MA(5) at 287.71K showing sustained interest
The chart display
AVA-1,25%
- Reward
- 2
- Comment
- Repost
- Share
Load More
Join 40M users in our growing community
⚡️ Join 40M users in the crypto craze discussion
💬 Engage with your favorite top creators
👍 See what interests you
Trending Topics
13.62K Popularity
76.41K Popularity
30.81K Popularity
10.64K Popularity
11.2K Popularity
9.72K Popularity
9.15K Popularity
8.57K Popularity
74.64K Popularity
21.93K Popularity
82.68K Popularity
23.74K Popularity
50.59K Popularity
44.14K Popularity
179.55K Popularity
News
View MoreU.S. stocks narrow gains, Dow turns lower, Nasdaq rises 0.2%
18 m
Solana daily active validators drop below 800, down over 65% from the 2023 peak
43 m
Beasant: Strong dollar policy narrows the impact on long-term U.S. Treasury yields
50 m
Zcash Foundation releases 2026 strategic priorities: Zebra, FROST, and Privacy Protection Assistance Program
51 m
Bezent: The United States has long pursued a strong dollar policy and will not intervene in the foreign exchange market.
55 m
Pin