As of Saturday, Ripple (XRP) is trading sideways, trapped between support around $1.25 and resistance at $1.67. This cautious movement reflects investor hesitation amid increasing uncertainties from tensions in the Middle East.
Ripple Prime Supports Coinbase Derivatives Contracts
Ripple, in partnership with Nodal Clear, announced on Thursday that Ripple Prime clients can now access Coinbase Derivatives’ full derivatives portfolio.
This includes high-liquidity nano futures for Bitcoin and Ethereum, as well as institutional and nano contracts for Solana and XRP. This expansion allows investors to access more hedging tools and flexible trading options in the digital asset market.
Trades are operated continuously 24/7 within a regulated environment through an ecosystem comprising Coinbase Derivatives, Hidden Road Partners, and a network of Futures Commission Merchants (FCMs).
According to Business Wire, Ripple Prime offers multi-asset prime brokerage services, integrating trading technology, clearing, and financing solutions to help organizations participate more efficiently in the cryptocurrency market.
XRP Faces Waning Interest from Retail Investors
The prolonged decline of XRP since reaching a historic high of $3.66 in July has caused many retail investors to step back temporarily, significantly cooling the derivatives market. As a result, open interest (OI) in futures contracts continues to shrink.
As of Saturday, OI stood at $2.33 billion, down slightly from $2.35 billion the previous day.
Previously, this indicator peaked at $10.94 billion in July. However, persistent selling pressure in the derivatives market has noticeably reduced retail investor interest. OI reflects the total notional value of open futures contracts, indicating market participation and liquidity flow.
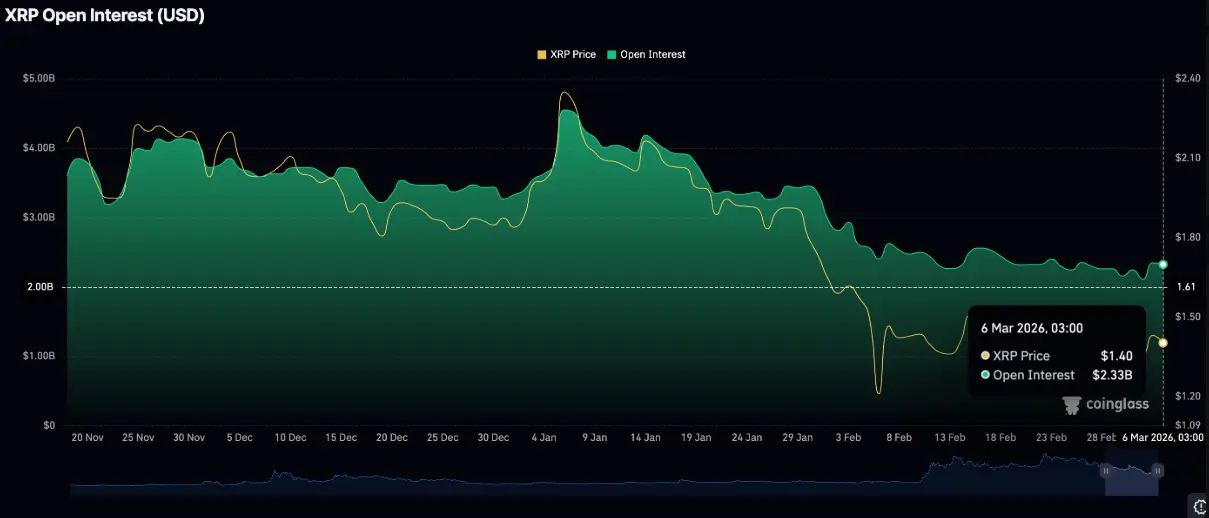 XRP Open Contracts | Source: CoinGlass## Technical Outlook: XRP Maintains Key Support
XRP is currently trading within a narrow range from $1.25 to $1.67, with the nearest support level around $1.40.
On the daily chart, the SuperTrend indicator is creating resistance near $1.61, keeping the short-term trend slightly bearish, although selling pressure has not yet intensified.
Notably, XRP’s price remains below the 50-day, 100-day, and 200-day exponential moving averages (EMAs). All these EMAs are trending downward, indicating that the bearish trend still dominates the market.
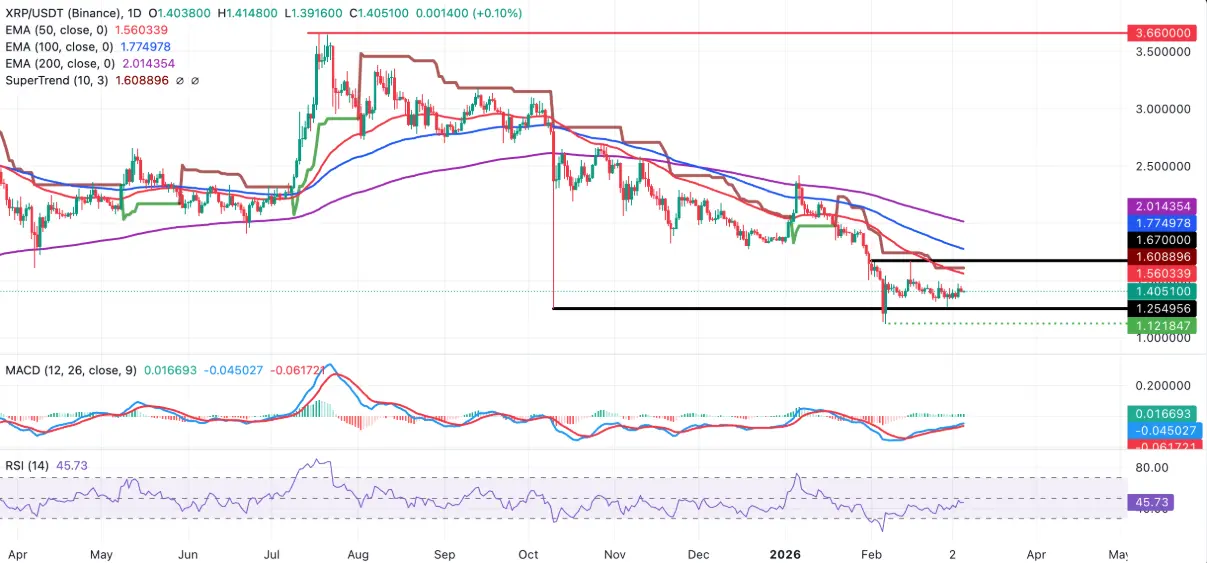 Daily XRP/USDT Chart | Source: TradingView Meanwhile, the MACD indicator’s MACD line remains above the signal line, but the green histogram bars are gradually shrinking, reflecting weakening momentum and an uncertain recovery.
On the upside, the nearest resistance zone is around the 50-day EMA at approximately $1.56. If XRP breaks above this level, the price could extend its rally toward the current range high near $1.67. In the medium term, the 100-day EMA at $1.77 is a potential target.
Conversely, if selling pressure increases, immediate support is at the reaction low around $1.40, followed by the Wednesday low at $1.35. A decisive break below these levels could push XRP back toward the key support zone formed on October 10 at $1.25.
SN_Nour
Disclaimer: The information on this page may come from third parties and does not represent the views or opinions of Gate. The content displayed on this page is for reference only and does not constitute any financial, investment, or legal advice. Gate does not guarantee the accuracy or completeness of the information and shall not be liable for any losses arising from the use of this information. Virtual asset investments carry high risks and are subject to significant price volatility. You may lose all of your invested principal. Please fully understand the relevant risks and make prudent decisions based on your own financial situation and risk tolerance. For details, please refer to
Disclaimer.
