This article provides an in-depth comparison between Movement Network (MOVE) and Synthetix (SNX) regarding yield optimization, examining price trends, tokenomics, and institutional adoption. Key issues addressed include investment strategies, market and regulatory risks, and technical development. Suitable for both new and experienced investors, it offers insights into selecting the better buy based on risk tolerance and market outlook. With an emphasis on DeFi applications, the article aims to enhance understanding of MOVE's NFT focus and SNX's synthetic asset offerings. Check real-time prices on Gate for detailed investment evaluation.
Introduction: Investment Comparison of MOVE vs SNX
In the cryptocurrency market, the comparison between Movement Network vs Synthetix has been an unavoidable topic for investors. The two not only show significant differences in market cap ranking, application scenarios, and price performance but also represent different positions in the crypto asset space.
Movement Network (MOVE): Since its launch, it has gained market recognition for enabling developers to build secure, performant, and interoperable blockchain applications.
Synthetix (SNX): Introduced in 2018, it has been hailed as a platform for creating synthetic assets, becoming one of the prominent projects in the decentralized finance (DeFi) space.
This article will comprehensively analyze the investment value comparison between MOVE vs SNX, focusing on historical price trends, supply mechanisms, institutional adoption, technological ecosystems, and future predictions, attempting to answer the question investors care about most:
"Which is the better buy right now?"
I. Price History Comparison and Current Market Status
MOVE and SNX Historical Price Trends
- 2024: MOVE reached its all-time high of $1.34 on December 9, 2024.
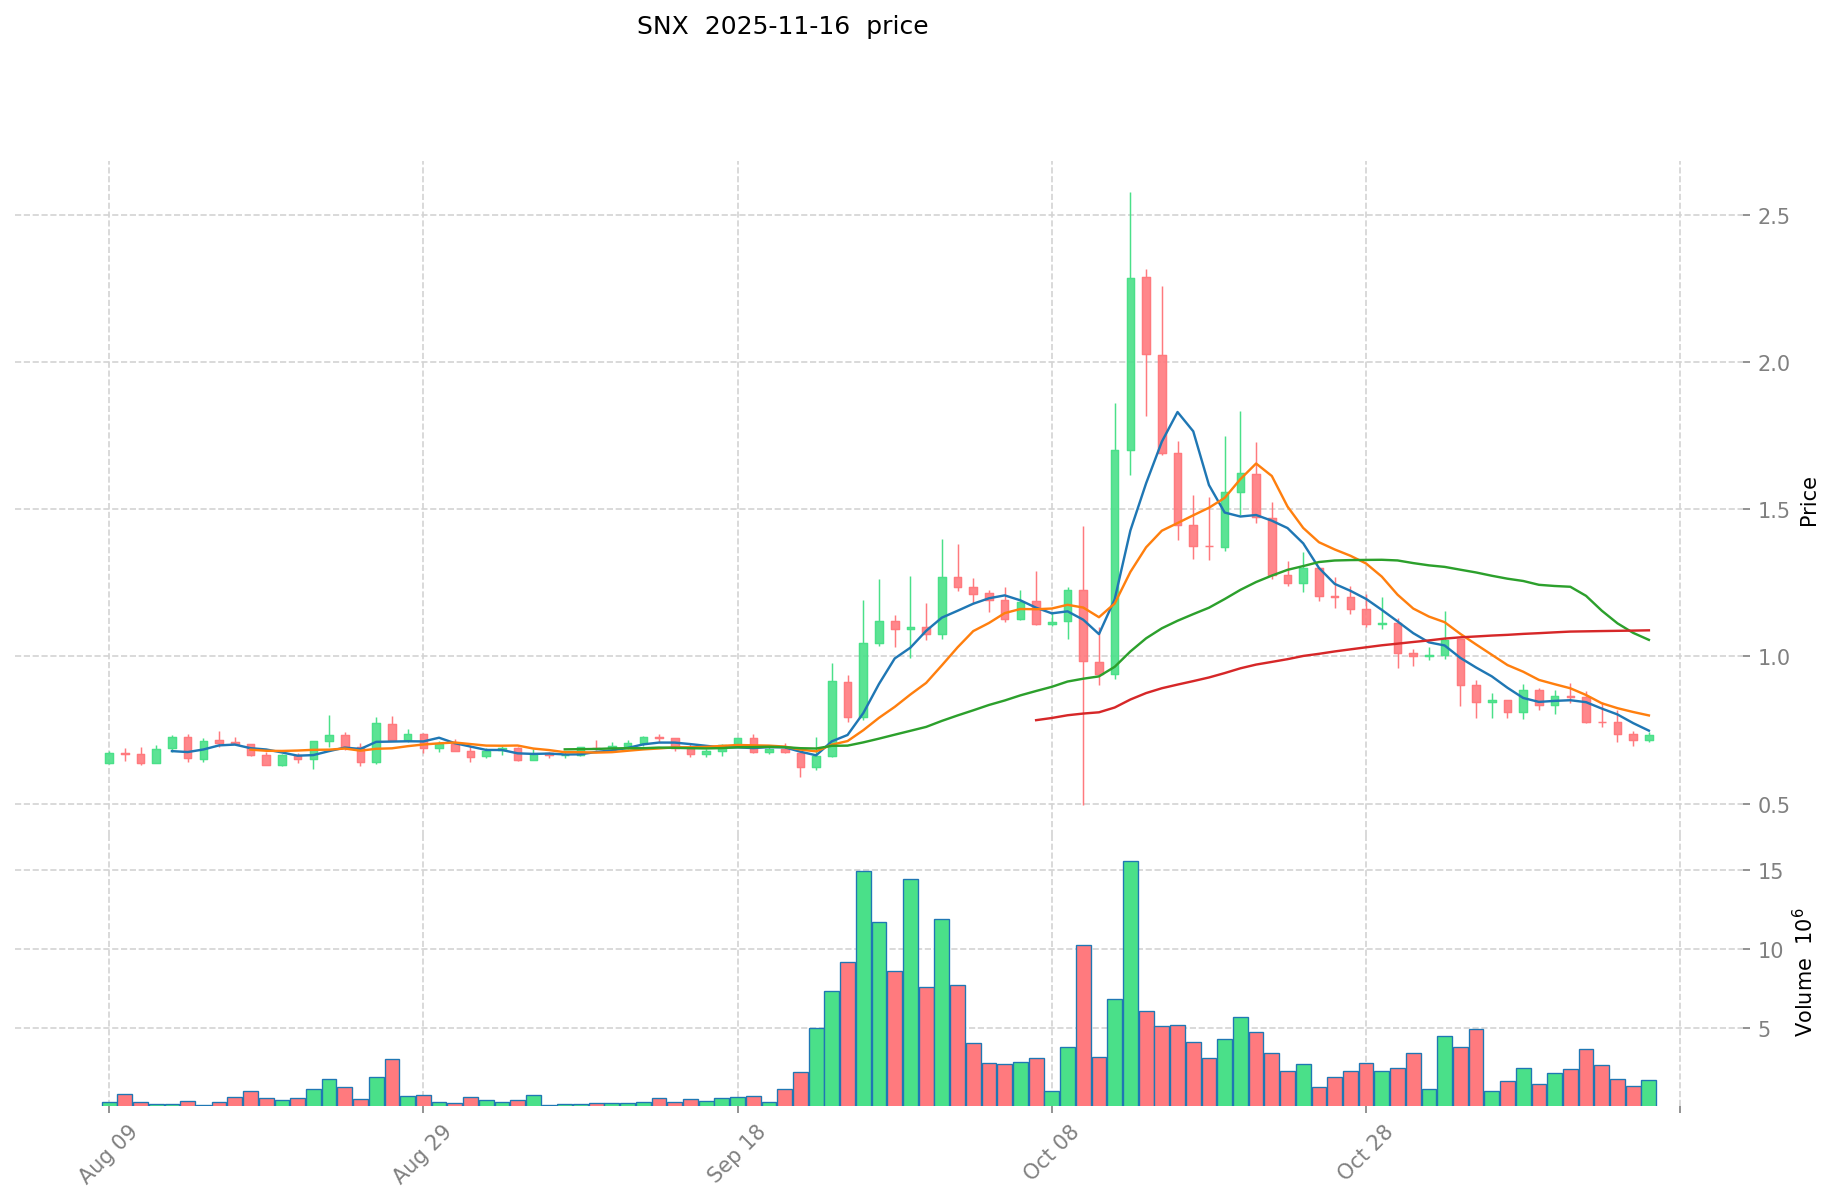
- 2021: SNX hit its all-time high of $28.53 on February 14, 2021.
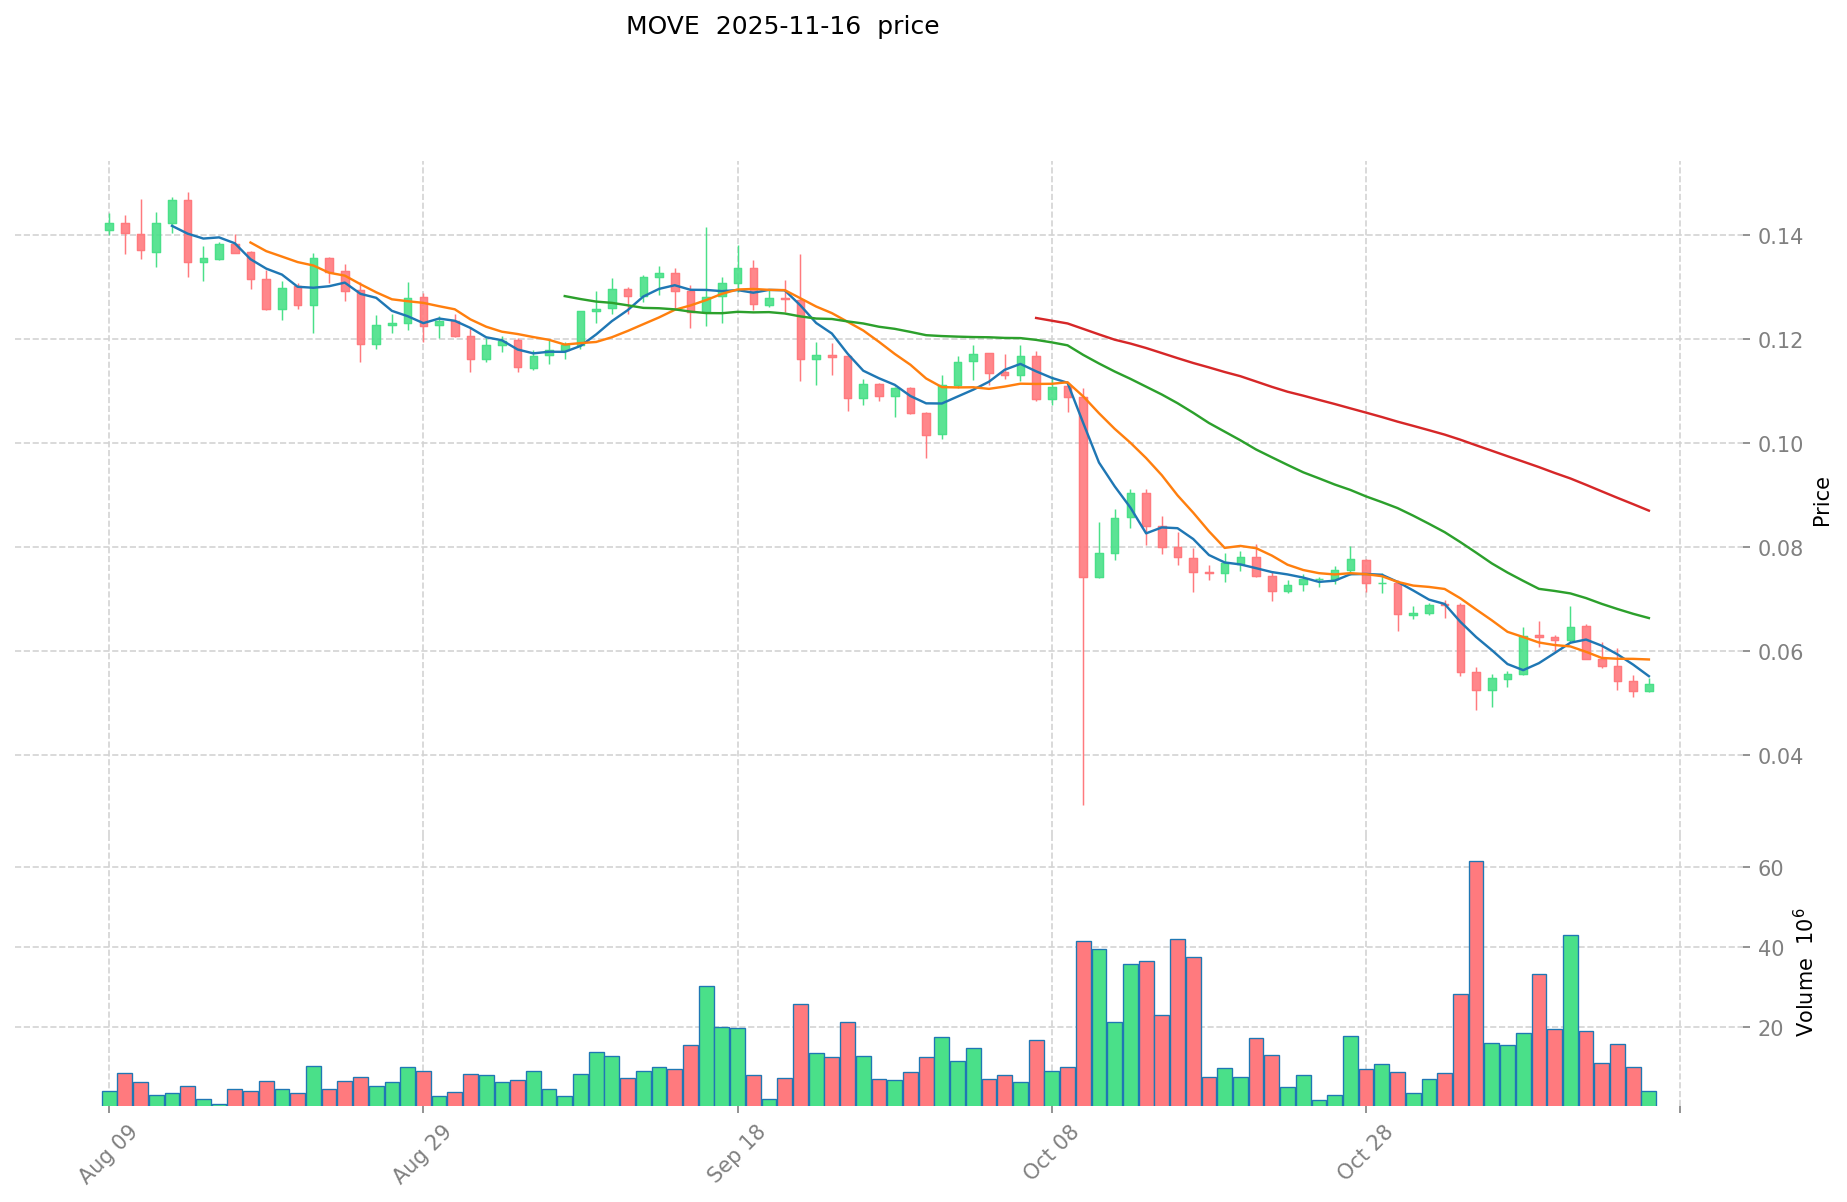
- Comparative analysis: In the recent market cycle, MOVE dropped from its high of $1.34 to a low of $0.03033, while SNX declined from its peak of $28.53 to its current price of $0.7272.
Current Market Situation (2025-11-16)
- MOVE current price: $0.05292
- SNX current price: $0.7272
- 24-hour trading volume: $204,125.97 (MOVE) vs $1,239,039.20 (SNX)
- Market Sentiment Index (Fear & Greed Index): 10 (Extreme Fear)
Click to view real-time prices:
- Check MOVE current price Market Price
- Check SNX current price Market Price
II. Core Factors Affecting MOVE vs SNX Investment Value
Supply Mechanism Comparison (Tokenomics)
- MOVE: Deflationary model with token burning mechanism and capped supply of 1 billion tokens
- SNX: Inflationary model with continuous rewards issuance, though staking incentives help balance circulating supply
- 📌 Historical Pattern: MOVE's deflationary nature tends to create supply pressure during market uptrends, while SNX's inflation requires active participation in staking to offset dilution effects.
Institutional Adoption and Market Applications
- Institutional Holdings: SNX has gained more institutional interest due to its established position in DeFi derivatives, while MOVE's institutional adoption is still emerging
- Enterprise Adoption: SNX has broader implementation in derivatives protocols and yield strategies, while MOVE focuses on more specific DeFi use cases through BlueMove ecosystem
- Regulatory Attitudes: Both face similar regulatory uncertainties as DeFi tokens, though SNX's longer track record provides slightly more regulatory clarity
Technical Development and Ecosystem Building
- MOVE Technical Upgrades: Focused on expanding the Sui-based NFT marketplace and developing cross-chain capabilities
- SNX Technical Development: Continually enhancing the Synthetix V3 protocol with improved capital efficiency and multi-chain deployment
- Ecosystem Comparison: SNX has a more mature DeFi ecosystem with established synthetic assets and derivatives infrastructure, while MOVE is building its presence in the NFT marketplace segment with emphasis on the Sui blockchain
Macroeconomic and Market Cycles
- Performance During Inflation: SNX potentially offers better inflation hedge through its diverse synthetic assets exposure
- Macroeconomic Monetary Policy: Both tokens show sensitivity to interest rate changes, with SNX historically demonstrating higher correlation to broader market moves
- Geopolitical Factors: SNX's global derivatives exposure provides more diversification against regional economic risks
III. 2025-2030 Price Prediction: MOVE vs SNX
Short-term Prediction (2025)
- MOVE: Conservative $0.051216 - $0.0528 | Optimistic $0.0528 - $0.072336
- SNX: Conservative $0.652815 - $0.7335 | Optimistic $0.7335 - $0.755505
Mid-term Prediction (2027)
- MOVE may enter a growth phase, with expected prices ranging from $0.0386326116 to $0.080180892
- SNX may enter a steady growth phase, with expected prices ranging from $0.43709741775 to $0.80517945375
- Key drivers: Institutional capital inflow, ETF, ecosystem development
Long-term Prediction (2030)
- MOVE: Base scenario $0.065767571209494 - $0.1133923641543 | Optimistic scenario $0.1133923641543 - $0.120195906003558
- SNX: Base scenario $0.785574441172936 - $0.882667911430265 | Optimistic scenario $0.882667911430265 - $0.988588060801897
View detailed price predictions for MOVE and SNX
Disclaimer
MOVE:
| 年份 |
预测最高价 |
预测平均价格 |
预测最低价 |
涨跌幅 |
| 2025 |
0.072336 |
0.0528 |
0.051216 |
0 |
| 2026 |
0.08321544 |
0.062568 |
0.046926 |
18 |
| 2027 |
0.080180892 |
0.07289172 |
0.0386326116 |
37 |
| 2028 |
0.11403909594 |
0.076536306 |
0.05587150338 |
44 |
| 2029 |
0.1314970273386 |
0.09528770097 |
0.0705128987178 |
80 |
| 2030 |
0.120195906003558 |
0.1133923641543 |
0.065767571209494 |
114 |
SNX:
| 年份 |
预测最高价 |
预测平均价格 |
预测最低价 |
涨跌幅 |
| 2025 |
0.755505 |
0.7335 |
0.652815 |
0 |
| 2026 |
0.78917265 |
0.7445025 |
0.647717175 |
2 |
| 2027 |
0.80517945375 |
0.766837575 |
0.43709741775 |
5 |
| 2028 |
0.91962996181875 |
0.786008514375 |
0.51090553434375 |
8 |
| 2029 |
0.912516584763656 |
0.852819238096875 |
0.665199005715562 |
17 |
| 2030 |
0.988588060801897 |
0.882667911430265 |
0.785574441172936 |
21 |
IV. Investment Strategy Comparison: MOVE vs SNX
Long-term vs Short-term Investment Strategies
- MOVE: Suitable for investors focused on NFT marketplace potential and Sui ecosystem growth
- SNX: Suitable for investors seeking exposure to DeFi derivatives and synthetic assets
Risk Management and Asset Allocation
- Conservative investors: MOVE: 30% vs SNX: 70%
- Aggressive investors: MOVE: 60% vs SNX: 40%
- Hedging tools: Stablecoin allocation, options, cross-token portfolio diversification
V. Potential Risk Comparison
Market Risk
- MOVE: Higher volatility due to smaller market cap and emerging ecosystem
- SNX: Exposure to broader DeFi market fluctuations and synthetic asset risks
Technical Risk
- MOVE: Scalability, network stability on Sui blockchain
- SNX: Smart contract vulnerabilities, oracle dependencies
Regulatory Risk
- Global regulatory policies may impact both tokens differently, with SNX potentially facing more scrutiny due to its synthetic assets offerings
VI. Conclusion: Which Is the Better Buy?
📌 Investment Value Summary:
- MOVE advantages: Deflationary model, growing NFT marketplace on Sui blockchain
- SNX advantages: Established DeFi presence, diverse synthetic assets exposure
✅ Investment Advice:
- New investors: Consider a smaller allocation to MOVE for higher risk/reward, larger allocation to SNX for more established DeFi exposure
- Experienced investors: Balanced portfolio with both tokens, adjusting based on risk tolerance and market cycles
- Institutional investors: Evaluate SNX for its established market presence, consider MOVE for potential emerging technology exposure
⚠️ Risk Warning: The cryptocurrency market is highly volatile, and this article does not constitute investment advice.
None
VII. FAQ
Q1: What are the main differences between MOVE and SNX?
A: MOVE is a deflationary token focused on the NFT marketplace on the Sui blockchain, while SNX is an inflationary token that powers the Synthetix platform for creating synthetic assets in the DeFi space.
Q2: Which token has performed better historically?
A: SNX reached its all-time high of $28.53 in February 2021, while MOVE's all-time high was $1.34 in December 2024. However, both have experienced significant price drops since their peaks.
Q3: How do their current market situations compare?
A: As of 2025-11-16, MOVE's price is $0.05292 with a 24-hour trading volume of $204,125.97, while SNX's price is $0.7272 with a 24-hour trading volume of $1,239,039.20.
Q4: What are the key factors affecting the investment value of MOVE and SNX?
A: Key factors include supply mechanisms, institutional adoption, technical development, ecosystem building, and macroeconomic conditions.
Q5: How do the long-term price predictions for MOVE and SNX compare?
A: By 2030, MOVE is predicted to range from $0.065767571209494 to $0.120195906003558, while SNX is expected to range from $0.785574441172936 to $0.988588060801897 in the base scenario.
Q6: What are the main risks associated with investing in MOVE and SNX?
A: Both face market risks, technical risks, and regulatory risks. MOVE may have higher volatility due to its smaller market cap, while SNX faces risks related to synthetic asset exposure and broader DeFi market fluctuations.
Q7: Which token might be more suitable for different types of investors?
A: New investors might consider a smaller allocation to MOVE for higher risk/reward and a larger allocation to SNX for more established DeFi exposure. Experienced investors could maintain a balanced portfolio with both tokens, while institutional investors might evaluate SNX for its established market presence and MOVE for potential emerging technology exposure.
* The information is not intended to be and does not constitute financial advice or any other recommendation of any sort offered or endorsed by Gate.


