Daily Analysis: BTC, ETH, STX, SOL, ADA
Markets are on slight bull activity today, with the global market cap sitting 3.4% below its previous 24-hour mark, as the total cap stands at $1.61T as of press time. The fear and greed index is 72, as greed now creeps back into the markets. The global trading volume is 26% up in 24 hours, at $65.7B as of press time
Bitcoin Price Analysis
Bitcoin (BTC) is riding on bull activity, as the Bitcoin price stood at $43K as of press time after recording a daily increase of 4.3% and a weekly rise of 2.9%. As a result of the Bitcoin price, the token’s trade volume jumped by 37% during the same period and is presently at $25.8B.
The Bollinger bands are far apart, showing high volatility levels on the Bitcoin price. The Relative Strength Index (RSI) is approaching a cross-over above the average line, showing bullish momentum on the Bitcoin price.
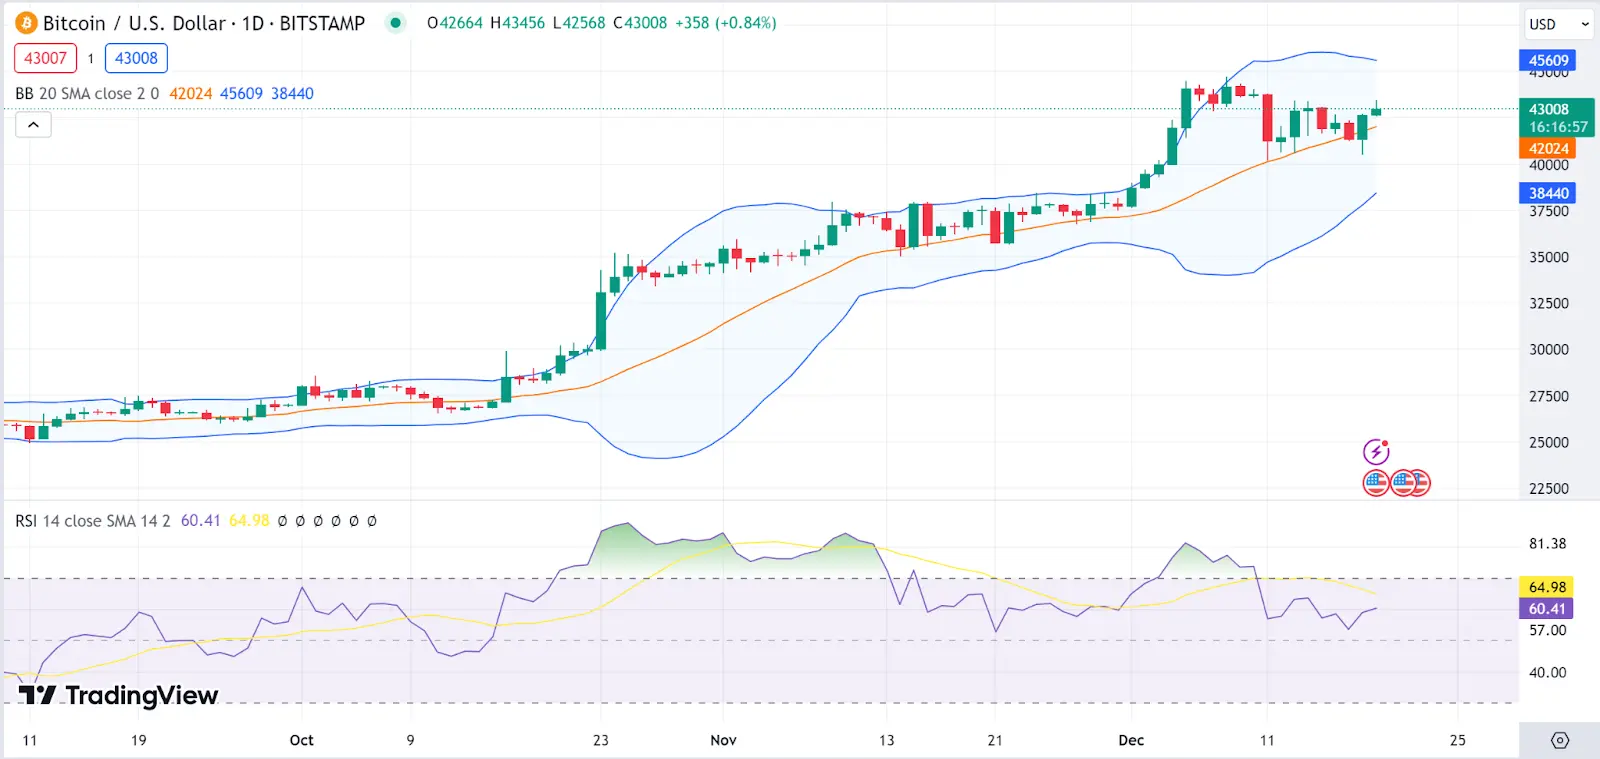 BTC 1-day chart | Source: TradingView## Ethereum Price Analysis
Ethereum (ETH) is also riding on bull activity, as the Ethereum price stood at $2,248 as of press time after recording a daily increase of 3.4% and a weekly rise of 0.8%. As a result of the Ethereum price, the token’s trade volume jumped by 31% during the same period and is presently at $10.6B.
The Bollinger bands are far, showing high volatility levels on the Ethereum price. The Relative Strength Index (RSI) is approaching a cross-over above the average line, showing bullish momentum on the Ethereum price.
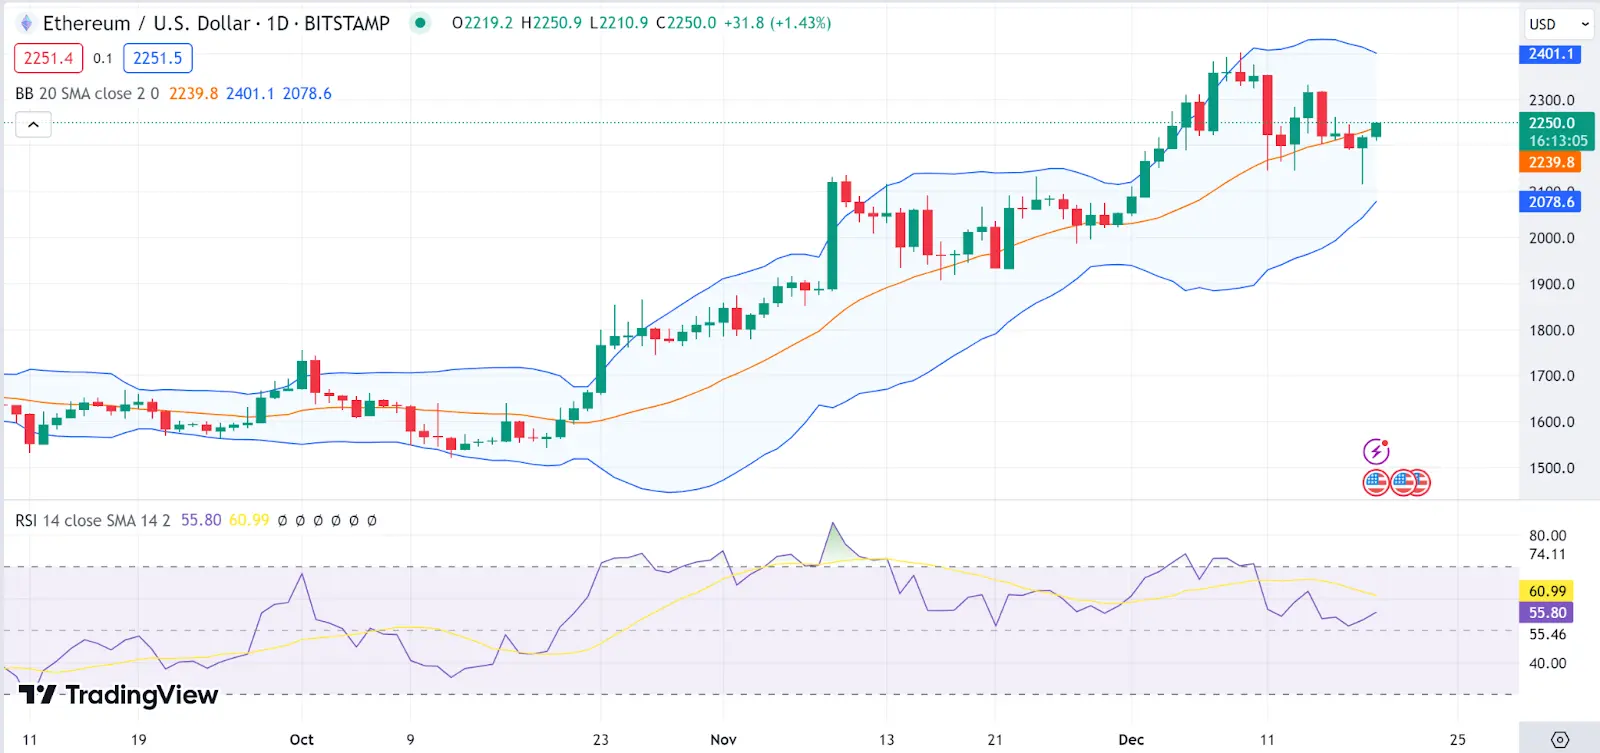 ETH 1-day chart | Source: TradingView## Stacks Price Analysis
Stacks (STX) is also riding on bull activity, as the Stacks price stood at $1.21 as of press time after recording a daily increase of 6.7% and a weekly rise of 26%. As a result of the Stacks price, the token’s trade volume jumped by 33% during the same period and is presently at $361M.
The Bollinger bands are far, showing high volatility levels on the Stacks price. The Relative Strength Index (RSI) is above the average line close to the overbought region, showing bull dominance on the Stacks price.
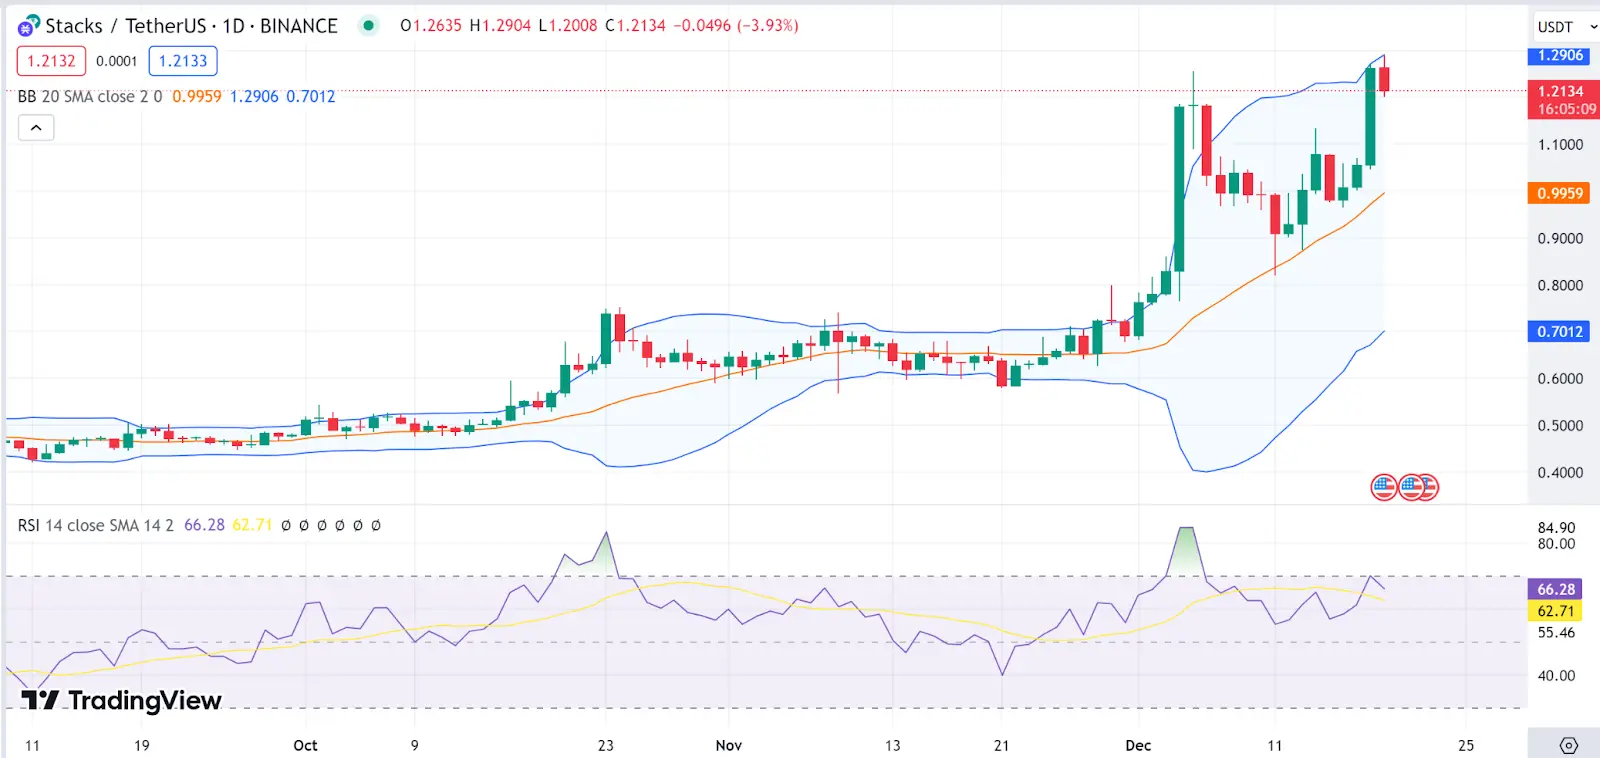 STX 1-day chart | Source: TradingView## Solana Price Analysis
Solana (SOL) is also riding on bull activity, as the Solana price stood at $76.17 as of press time after recording a daily increase of 3.4% and a weekly rise of 9.8%. As a result of the Solana price, the token’s trade volume jumped by 28% during the same period and is presently at $2.2B.
The Bollinger bands are far, showing high volatility levels on the Solana price. The Relative Strength Index (RSI) is approaching a cross-over above the average line, showing bullish momentum on the Solana price.
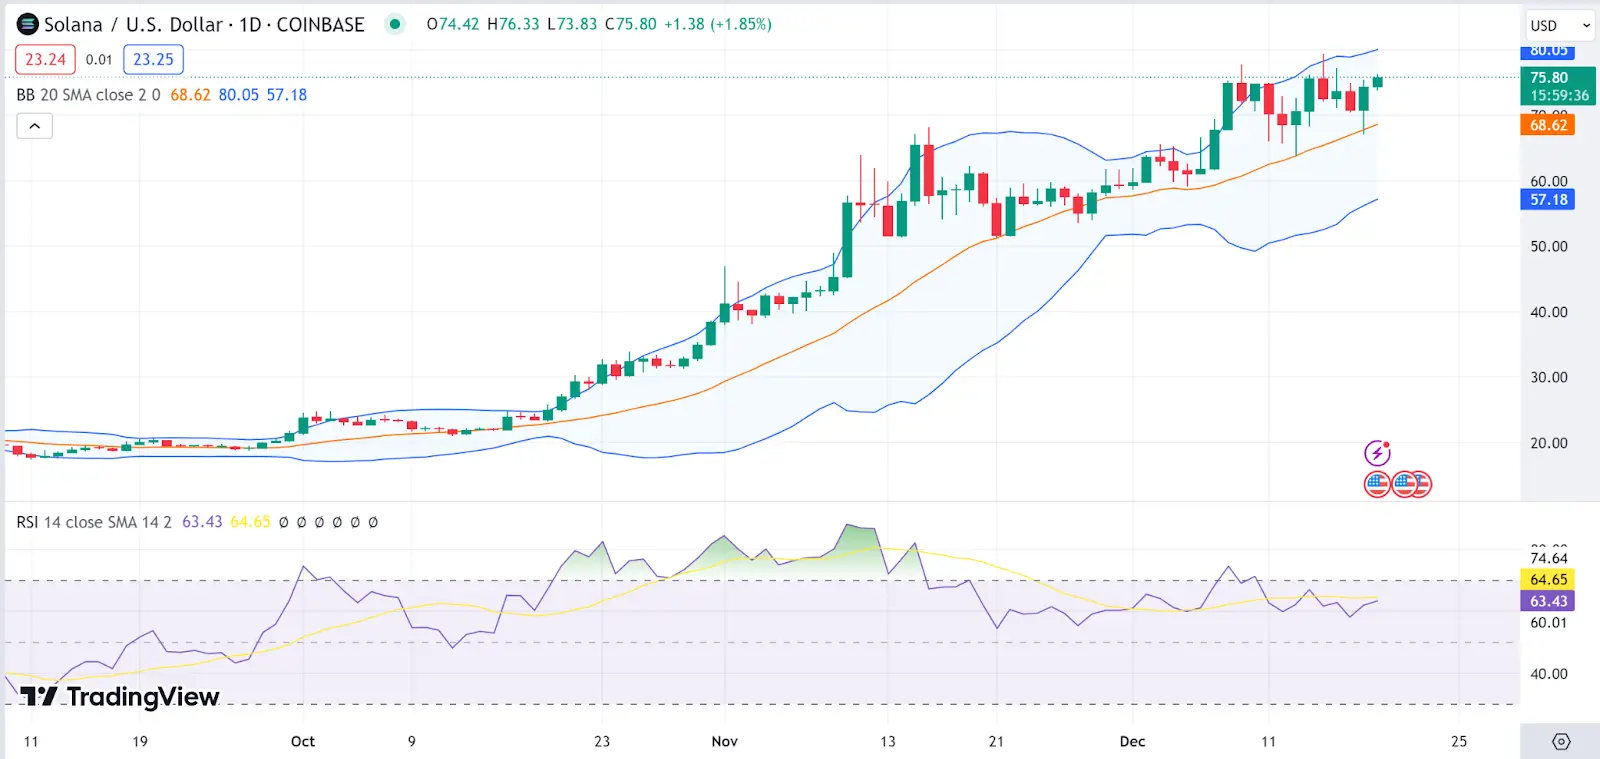 SOL 1-day chart | Source: TradingView## Cardano Price Analysis
Cardano (ADA) is also riding on bull activity, as the Cardano price stood at $0.6 as of press time after recording a daily increase of 7% and a weekly rise of 2.8%. As a result of the Cardano price, the token’s trade volume jumped by 30% during the same period and is presently at $765M.
The Bollinger bands are diverging, showing high volatility levels on the Cardano price. The Relative Strength Index (RSI) is approaching entry into the overbought region, showing bullish momentum on the Cardano price.
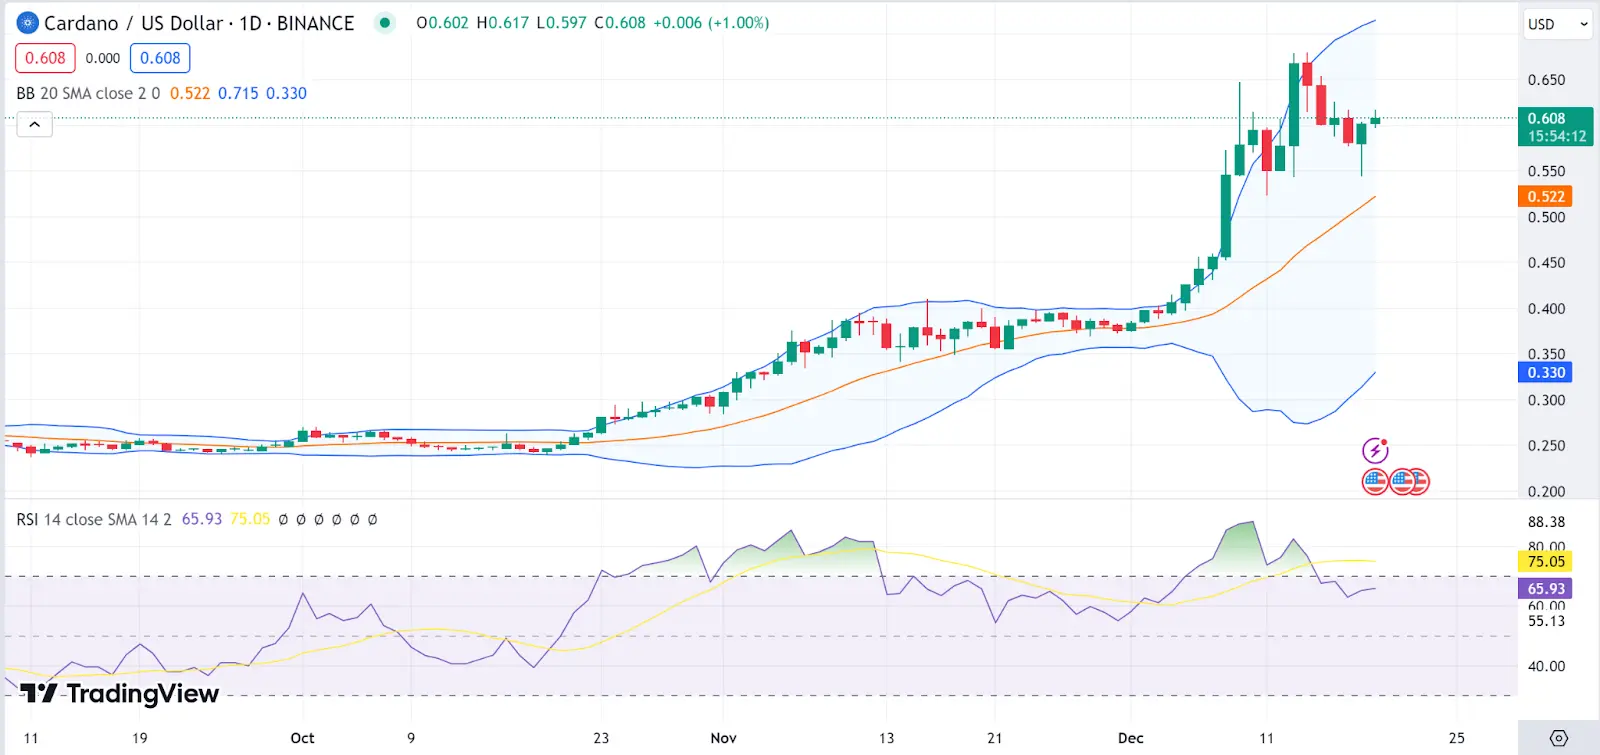 ADA 1-day chart | Source: TradingView