Bitcoin Whale Inflows to Exchanges Declined Ahead of BTC's Price Surge to $37K: CryptoQuant
CryptoPotato
The spot ETF optimism drove Bitcoin near $37,000, but there could have been more signs behind that rally. Gauging to Exchange Inflow – Spent Output Value Band metric, CryptoQuant analyst found an interesting shift in market dynamics.
The latest leg up comes as inflows from whales decrease while retail investor receipts rise.
Bitcoin Surge Faces Retail Threat?
The influx of Bitcoin into exchanges from large whale addresses has been on a decline when compared to previous years. Contrastingly, there is a rise in the amount received from individual retail investors, according to CryptoQuant’s latest analysis by ‘IT Tech.’
Exchange Inflow – Spent Output Value Bands’ chart displays the distribution of all spent outputs that have flowed into exchange wallets based on their value. Each colored band represents the ratio of the total value of spent outputs that flowed into exchanges within the specified range, thereby helping in gauging capital flow into exchanges from both whale and retail holders.
The latest data shows that the whales persist with their resilient strategy amid the recent price rallywhile retail players capitalize on gains.
Meanwhile, the spot volumes are currently at historic lows. The derivative volumes, on the other hand, have reached record highs relative to spot trading. The current spot-to-derivatives volume ratio stands at 0.06, indicating that spot volumes constitute a mere 6%, while derivatives represent 94% of market volumes.
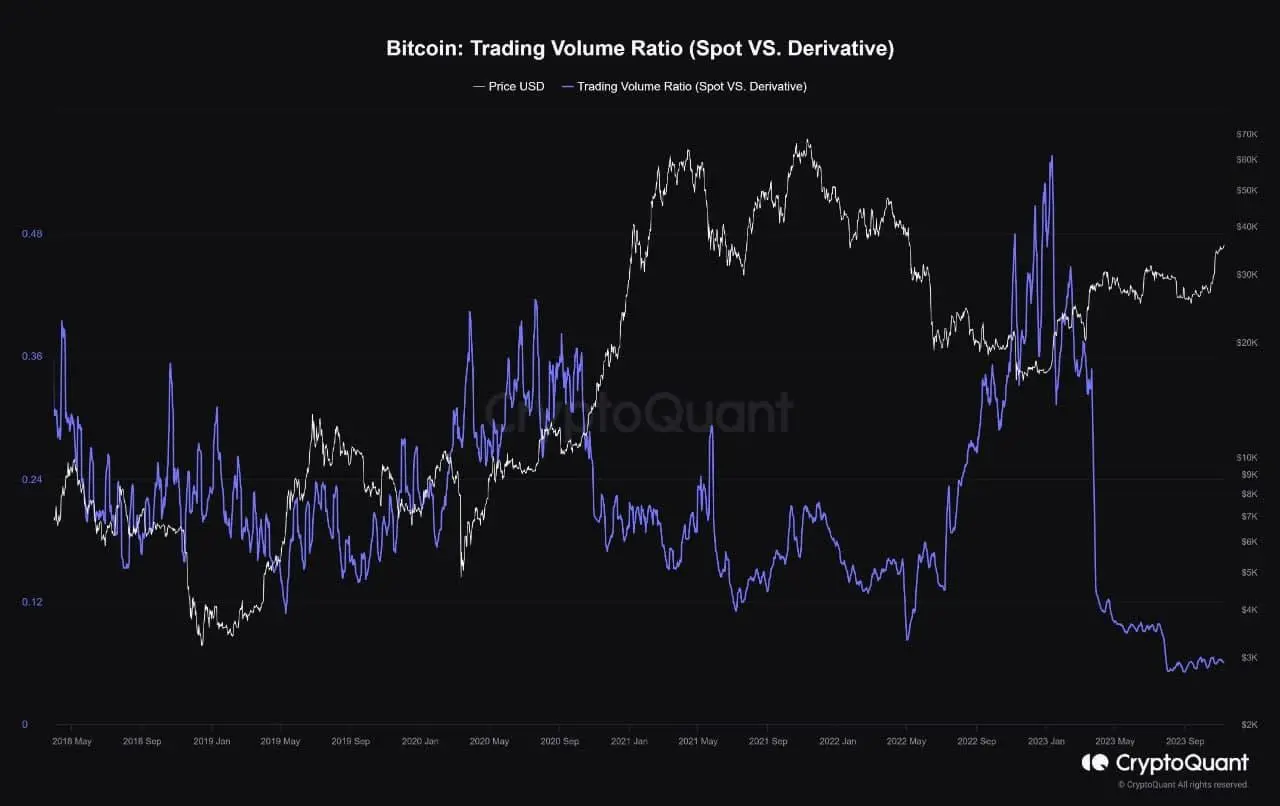 Bitcoin Trading Volume. Source: CryptoQuant## Tightness Within Bitcoin Supply
The trend was also confirmed by another blockchain intelligence platform, Glassnode, which observed a “powerful divergence” that has continued to form between the Bitcoin Long-Term Holder (LTH) supply and the Short-Term Holder (STH supply).
In its latest analysis, the firm said that while LTH supply is just shy of an all-time high, STH supply stands at effectively all-time lows, demonstrating a “growing tightness within the BTC supply” as existing holders become increasingly unwilling to part with their holdings.
“LTHs historically wait for the market to break to new price ATH before ramping up their distribution. This process can be seen by the large-scale decline in their supply during the 2021 bull run, which is matched by an uptick in STH Supply, as well as Exchange inflow volumes.”
Besides, the Sell-Side Risk Ratio uates investor spending behaviors by measuring the absolute value of profit or loss relative to the asset’s size (Realized Cap). High values indicate significant profit or loss, while low values suggest coins spent are near break-even.
Focusing on Short-Term Holders post the $35k rally, a spike in the ratio suggested a ‘re-awakening’ of young coins, thereby hinting at near-term profit-taking. Long-term holders continued to show a slight increase in the ratio, reminiscent of the 2016 and late 2020 periods of tight overall BTC supply.
免責事項:このページの情報は第三者から提供される場合があり、Gateの見解または意見を代表するものではありません。このページに表示される内容は参考情報のみであり、いかなる金融、投資、または法律上の助言を構成するものではありません。Gateは情報の正確性または完全性を保証せず、当該情報の利用に起因するいかなる損失についても責任を負いません。仮想資産への投資は高いリスクを伴い、大きな価格変動の影響を受けます。投資元本の全額を失う可能性があります。関連するリスクを十分に理解したうえで、ご自身の財務状況およびリスク許容度に基づき慎重に判断してください。詳細は免責事項をご参照ください。
コメント
0/400
コメントなし