
Key Takeaways
-
Fartcoin (FARTCOIN) is trading near $0.33 amid a broader crypto market sell-off driven by macro uncertainty.
-
The 4H chart shows a Bullish Bat harmonic pattern, often associated with short-term trend reversals.
-
Price has reacted positively from the D-point support near $0.288, hinting at seller exhaustion.
-
A breakout above the 50-period moving average around $0.374 could confirm bullish momentum.
-
Harmonic targets point toward $0.404 and $0.476 if the pattern plays out successfully.
-
A breakdown below $0.288 would invalidate the bullish setup.
As of January 19, 2026, Fartcoin (FARTCOIN) is trading slightly lower around $0.33, moving in line with the broader crypto market pullback. The sell-off was triggered by escalating US–EU trade tensions, which sparked nearly $875 million in long liquidations and pushed major assets like Bitcoin (BTC) and Ethereum (ETH) down more than 2% over the past 24 hours.
While FARTCOIN is down over 3% at the time of writing, the price action beneath the surface tells a more interesting story. The latest chart structure is now flashing a potential bullish harmonic setup, suggesting the current dip could be more of a setup than a breakdown.
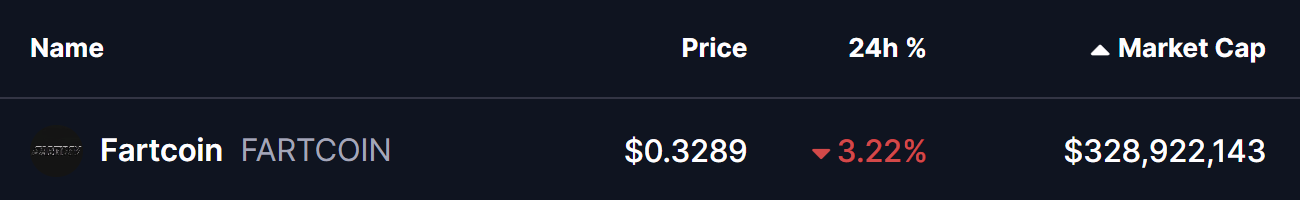
Source: Coinmarketcap
Harmonic Pattern Signals a Possible Reversal
On the 4-hour timeframe, Fartcoin is forming a well-defined Bullish Bat harmonic pattern, a structure often associated with short-term reversals after corrective phases.
The pattern began with the X point near $0.258, followed by a strong impulsive rally toward point A. Price then retraced to point B, rebounded to point C, and finally completed the structure at point D near $0.288. This D zone typically acts as the potential reversal area for the Bat pattern.
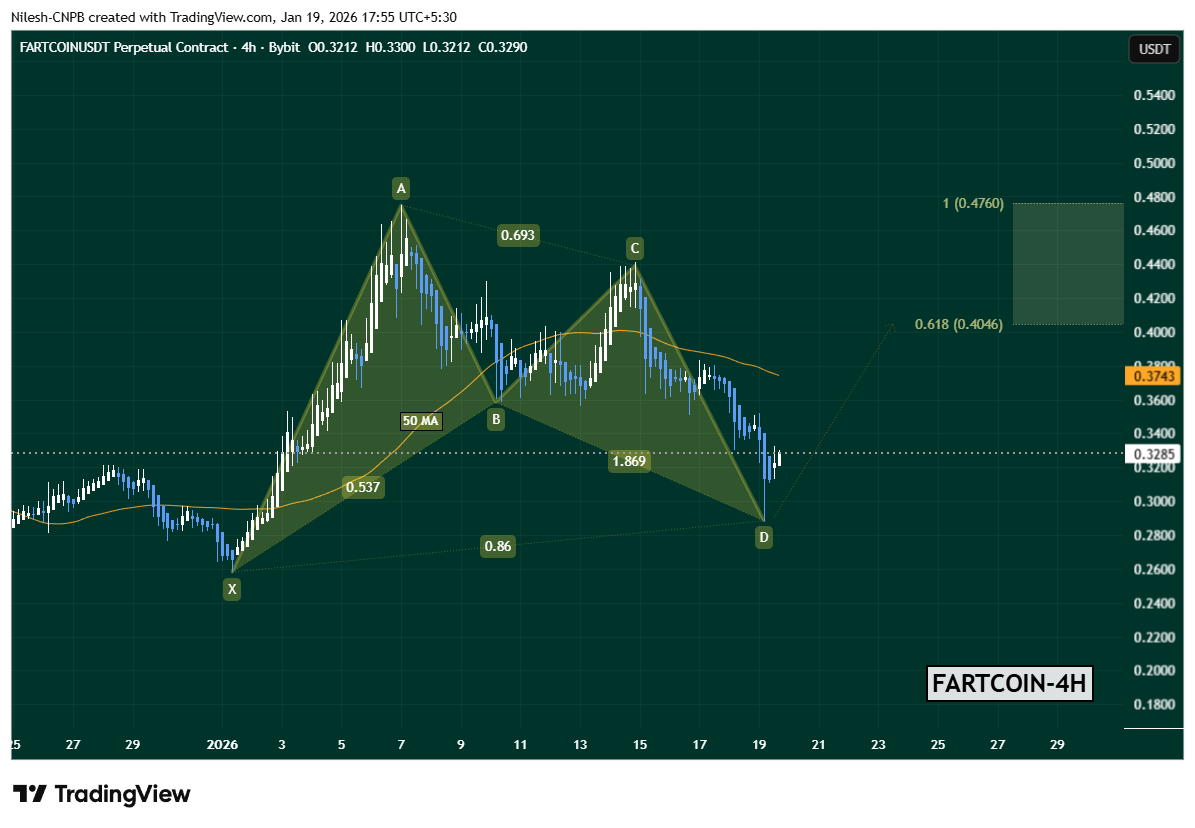
FARTCOIN Daily Chart/Coinsprobe (Source: Tradingview)
Following the completion of point D, FARTCOIN has already shown early signs of stabilization, bouncing back toward $0.3285. This initial reaction suggests that sellers may be losing momentum at current levels.
Key Levels That Could Decide the Move
One key level now in focus is the 50-period moving average, currently hovering around $0.3743. This level has acted as dynamic resistance in recent sessions and will likely determine whether the rebound gains traction or fades.
If buyers manage to push FARTCOIN above the 50 MA with improving volume, the harmonic projection opens the door for upside targets around:
This zone historically represents the area where Bat-pattern-driven moves tend to pause or face profit-taking.
On the flip side, the bullish setup remains valid only as long as price holds above the D-point support near $0.288. A decisive breakdown below this level would invalidate the harmonic structure and could expose FARTCOIN to deeper downside before any meaningful recovery attempt.
Bottom Line
Despite the ongoing market-wide weakness, Fartcoin’s chart is showing early signs of a technical rebound setup. The completion of a Bullish Bat harmonic pattern, combined with a developing bounce from key support, puts FARTCOIN at an important inflection point.
A breakout above the 50 MA could shift short-term momentum back in favor of the bulls, while failure to hold the D-point support would keep bears in control. For now, traders will be watching closely to see whether this harmonic signal translates into a sustained recovery or turns out to be another false start in a volatile market.
Disclaimer: The views and analysis presented in this article are for informational purposes only and reflect the author’s perspective, not financial advice. Technical patterns and indicators discussed are subject to market volatility and may or may not yield the anticipated results. Investors are advised to exercise caution, conduct independent research, and make decisions aligned with their individual risk tolerance.
About Author: Nilesh Hembade is the Founder and Lead Author of Coinsprobe, with over 5 years of experience in the cryptocurrency and blockchain industry. Since launching Coinsprobe in 2023, he has been providing daily, research-driven insights through in-depth market analysis, on-chain data, and technical research.
Disclaimer: The information on this page may come from third parties and does not represent the views or opinions of Gate. The content displayed on this page is for reference only and does not constitute any financial, investment, or legal advice. Gate does not guarantee the accuracy or completeness of the information and shall not be liable for any losses arising from the use of this information. Virtual asset investments carry high risks and are subject to significant price volatility. You may lose all of your invested principal. Please fully understand the relevant risks and make prudent decisions based on your own financial situation and risk tolerance. For details, please refer to
Disclaimer.
Articoli correlati
今日加密货币恐慌与贪婪指数降至9,市场处于极度恐慌状态
Gate News 消息,3月29日,Alternative.me 数据显示,今日加密货币恐慌与贪婪指数降至9,较昨日的12进一步下降,市场仍处于「极度恐慌状态」。
GateNews25m fa
Bittensor (TAO) Hits a 3-Month Peak: What Caused the Rally and What Comes Next?
Many leading cryptocurrencies have posted slight declines or negligible increases over the past 24 hours, but this isn’t the case for Bittensor (TAO), whose price soared by 15%.
The question now is whether this momentum can hold or if a pullback is coming next.
Further Gains
CryptoPotato1h fa
ETH 15分钟下跌0.85%:交易所资金流出与ETF减仓共振放大波动
2026-03-28 23:00至23:15(UTC)期间,ETH价格在1,989.32至2,012.0 USDT区间内震荡下行,录得-0.85%收益率,振幅达1.13%。这一时段市场关注度提升,短线波动加剧,引发交易者密切关注关键支撑区间表现。
本次异动的主要驱动力是3月以来ETH持续从主流交易所流向链上钱包,3月累计流出31.6百万枚,导致交易所流动性收缩,造成价格对大额订单较为敏感。同时,
GateNews1h fa
Is the XRP Bottom Finally Here? 3 Massive Bullish Signals You Need to See
Although in a more modest manner, XRP whales have returned to the scene, amassing more tokens over the past week, which is categorized as the first bullish sign for the underlying asset.
Another could come in the form of the technical tool used to determine whether that asset’s move in either
CryptoPotato2h fa
Bitcoin’s Most Dangerous Pattern Just Triggered: Will BTC Dump to $26K Next?
Although bitcoin has already dumped by over 50% from its all-time high of over $126,000 marked in October to a multi-year low of $60,000, the asset’s troubles might not be over, warned Merlijn The Trader.
The popular analyst indicated that the “most dangerous bitcoin pattern just completed phase
CryptoPotato2h fa
