Weekly Analysis: BTC, HNT, ORDI, AVAX, BEAM
Bitcoin price analysis
Bulls have dominated this week as most assets posted gains over the seven days. Bitcoin (BTC) has seen bull activity this week, recording a weekly increase of 10.7% as the price is $43.6K. Bitcoin has a market cap of $854B, and the trading volume stood at $14.6B as of press time.
Volatility on Bitcoin price for the week has been rising as the Bollinger Bands diverge. BTC’s relative strength indicator is above its average line in the overbought region, indicating bull dominance on Bitcoin price over the week.
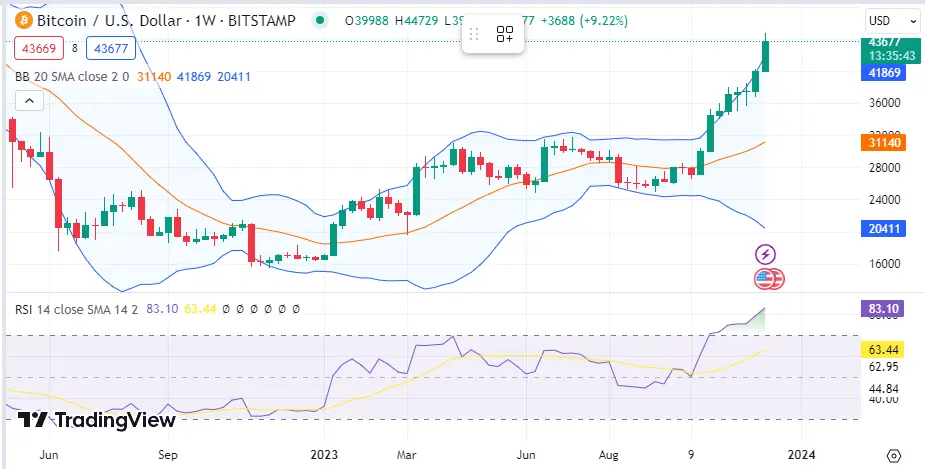 BTC 1-day chart | Source: TradingView## Helium price analysis
Helium (HNT) has seen bull activity this week, recording a weekly increase of 70% as the price is $$4.86. Helium has a market cap of $699M, and the trading volume stood at $10.1B as of press time.
Volatility on Helium price for the week has been rising as the Bollinger Bands diverge. HNT’s relative strength indicator is above its average line in the overbought region, indicating bull dominance on Helium price over the week.
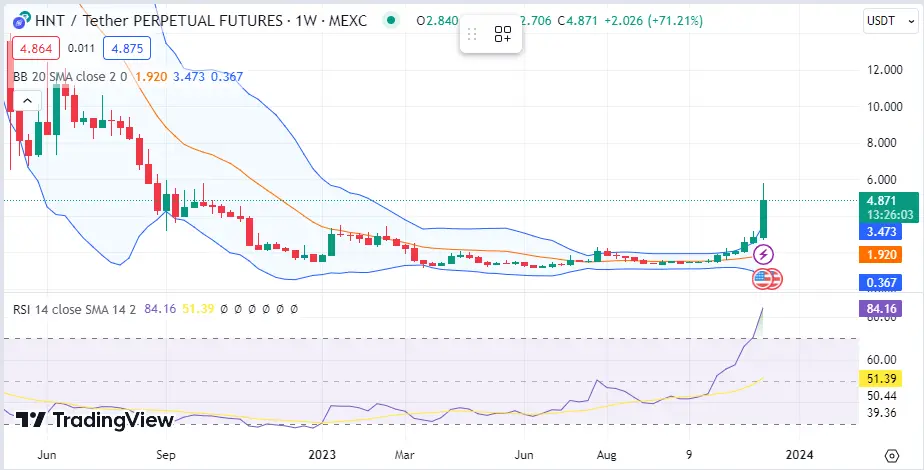 HNT 1-day chart | Source: TradingView## ORDI price analysis
ORDI (ORDI) has seen bull activity this week, recording a weekly increase of 53% as the price is $49.5. ORDI has a market cap of $881M, and the trading volume stood at $881M as of press time.
Volatility on ORDI price for the week has been rising as the Bollinger Bands diverge. ORDI’s relative strength indicator is above its average line in the overbought region, indicating bull dominance on ORDI price over the week.
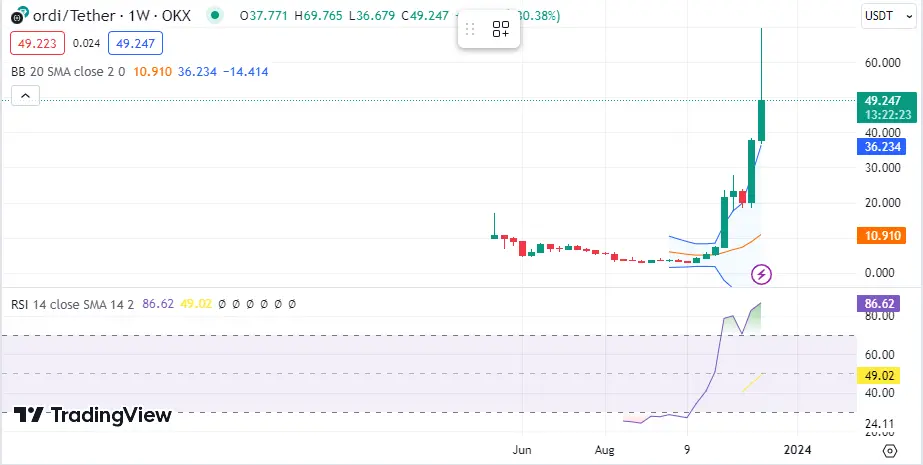 ORDI 1-day chart | Source: TradingView## Avalanche price analysis
Avalanche (AVAX) has seen bull activity this week, recording a weekly increase of 45% as the price is $32.08. Avalanche has a market cap of $1.3M, and the trading volume stood at $1.3B as of press time.
Volatility on Avalanche price for the week has been rising as the Bollinger Bands diverge. AVAX’s relative strength indicator is above its average line in the overbought region, indicating bull dominance on Avalanche price over the week.
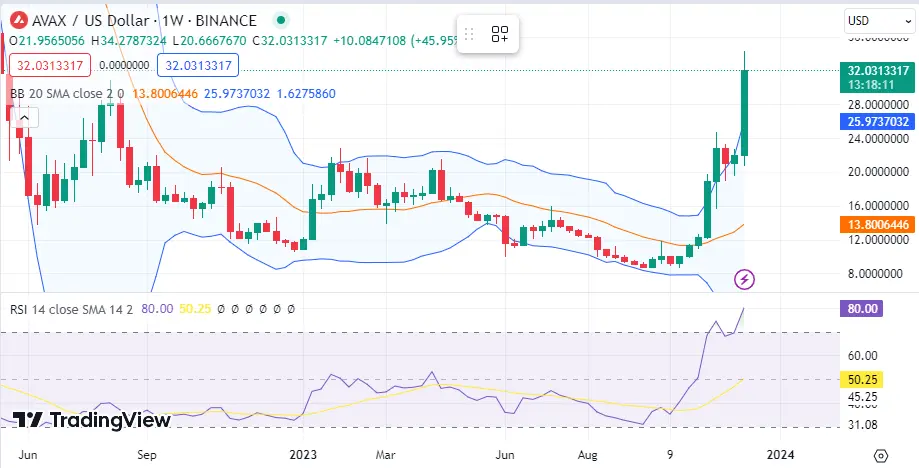 AVAX 1-day chart | Source: TradingView## Beam price analysis
Beam (BEAM) has seen bull activity this week, recording a weekly increase of 45% as the price is $0.01663. Helium has a market cap of $772M, and the trading volume stood at $113M as of press time.
Volatility on Beam price for the week has been rising as the Bollinger Bands diverge. BEAM’s relative strength indicator is above its average line, indicating bull dominance on Beam price over the week.
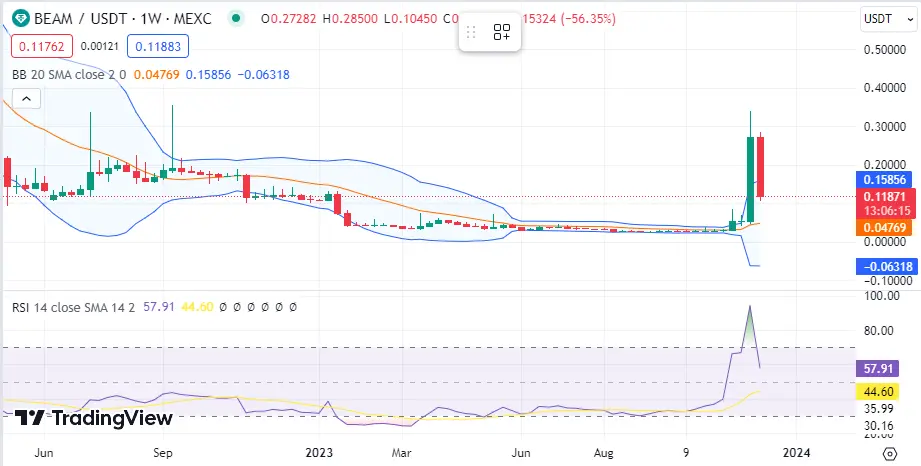 BEAM 1-day chart | Source: TradingView