ETH Testing $2K But is Another Correction Imminent? (Ethereum Price Analysis)
Technical Analysis
By TradingRage
Ethereum’s price fell below the key $2,000 level once more, following weeks of aggressive rallying. Yet, a bullish continuation could not be written off yet, as the market is seemingly climbing back above the mentioned level.
The Daily Chart
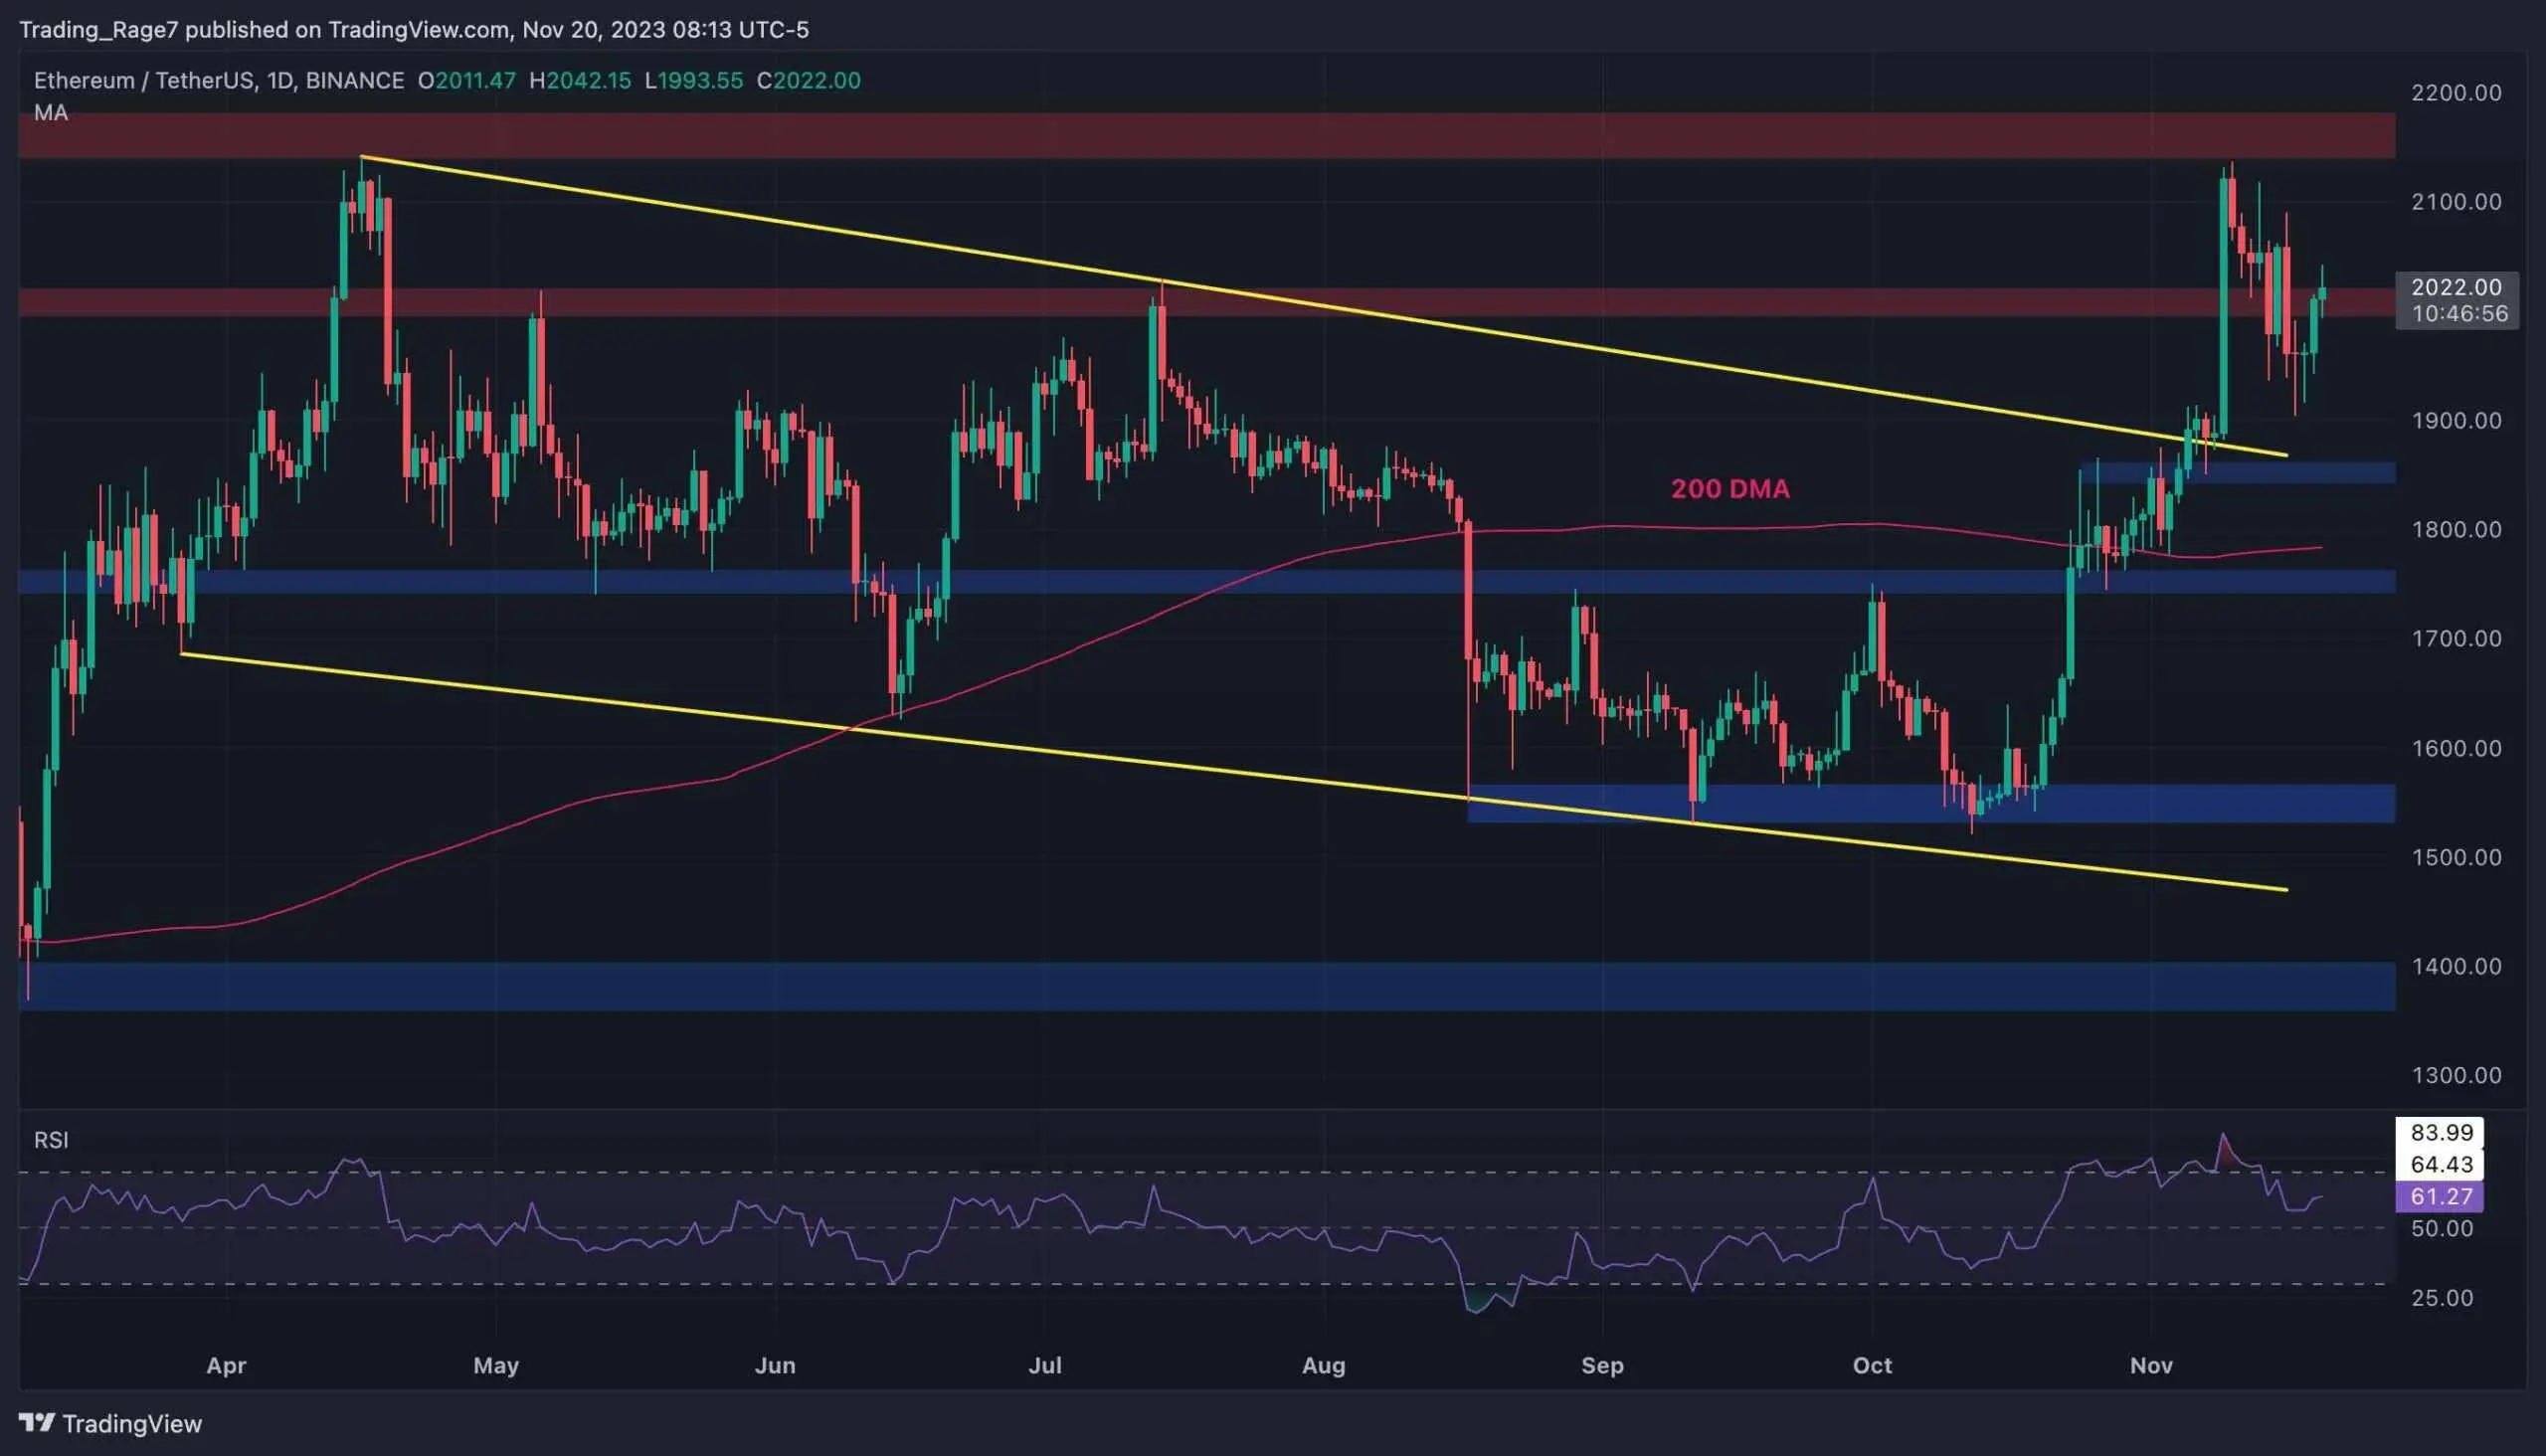
On the daily chart, the price has been rejected decisively from the $2,150 resistance level and dropped below the $2,000 mark.
The Relative Strength Index has previously pointed to the probability of this correction with a clear overbought signal. At the moment, the market is once again testing the $2,000 resistance level and might be able to break back above soon. The price action’s near future heavily relies on the reaction to the $2,000 zone.
 Source: TradingView### The 4-Hour Chart
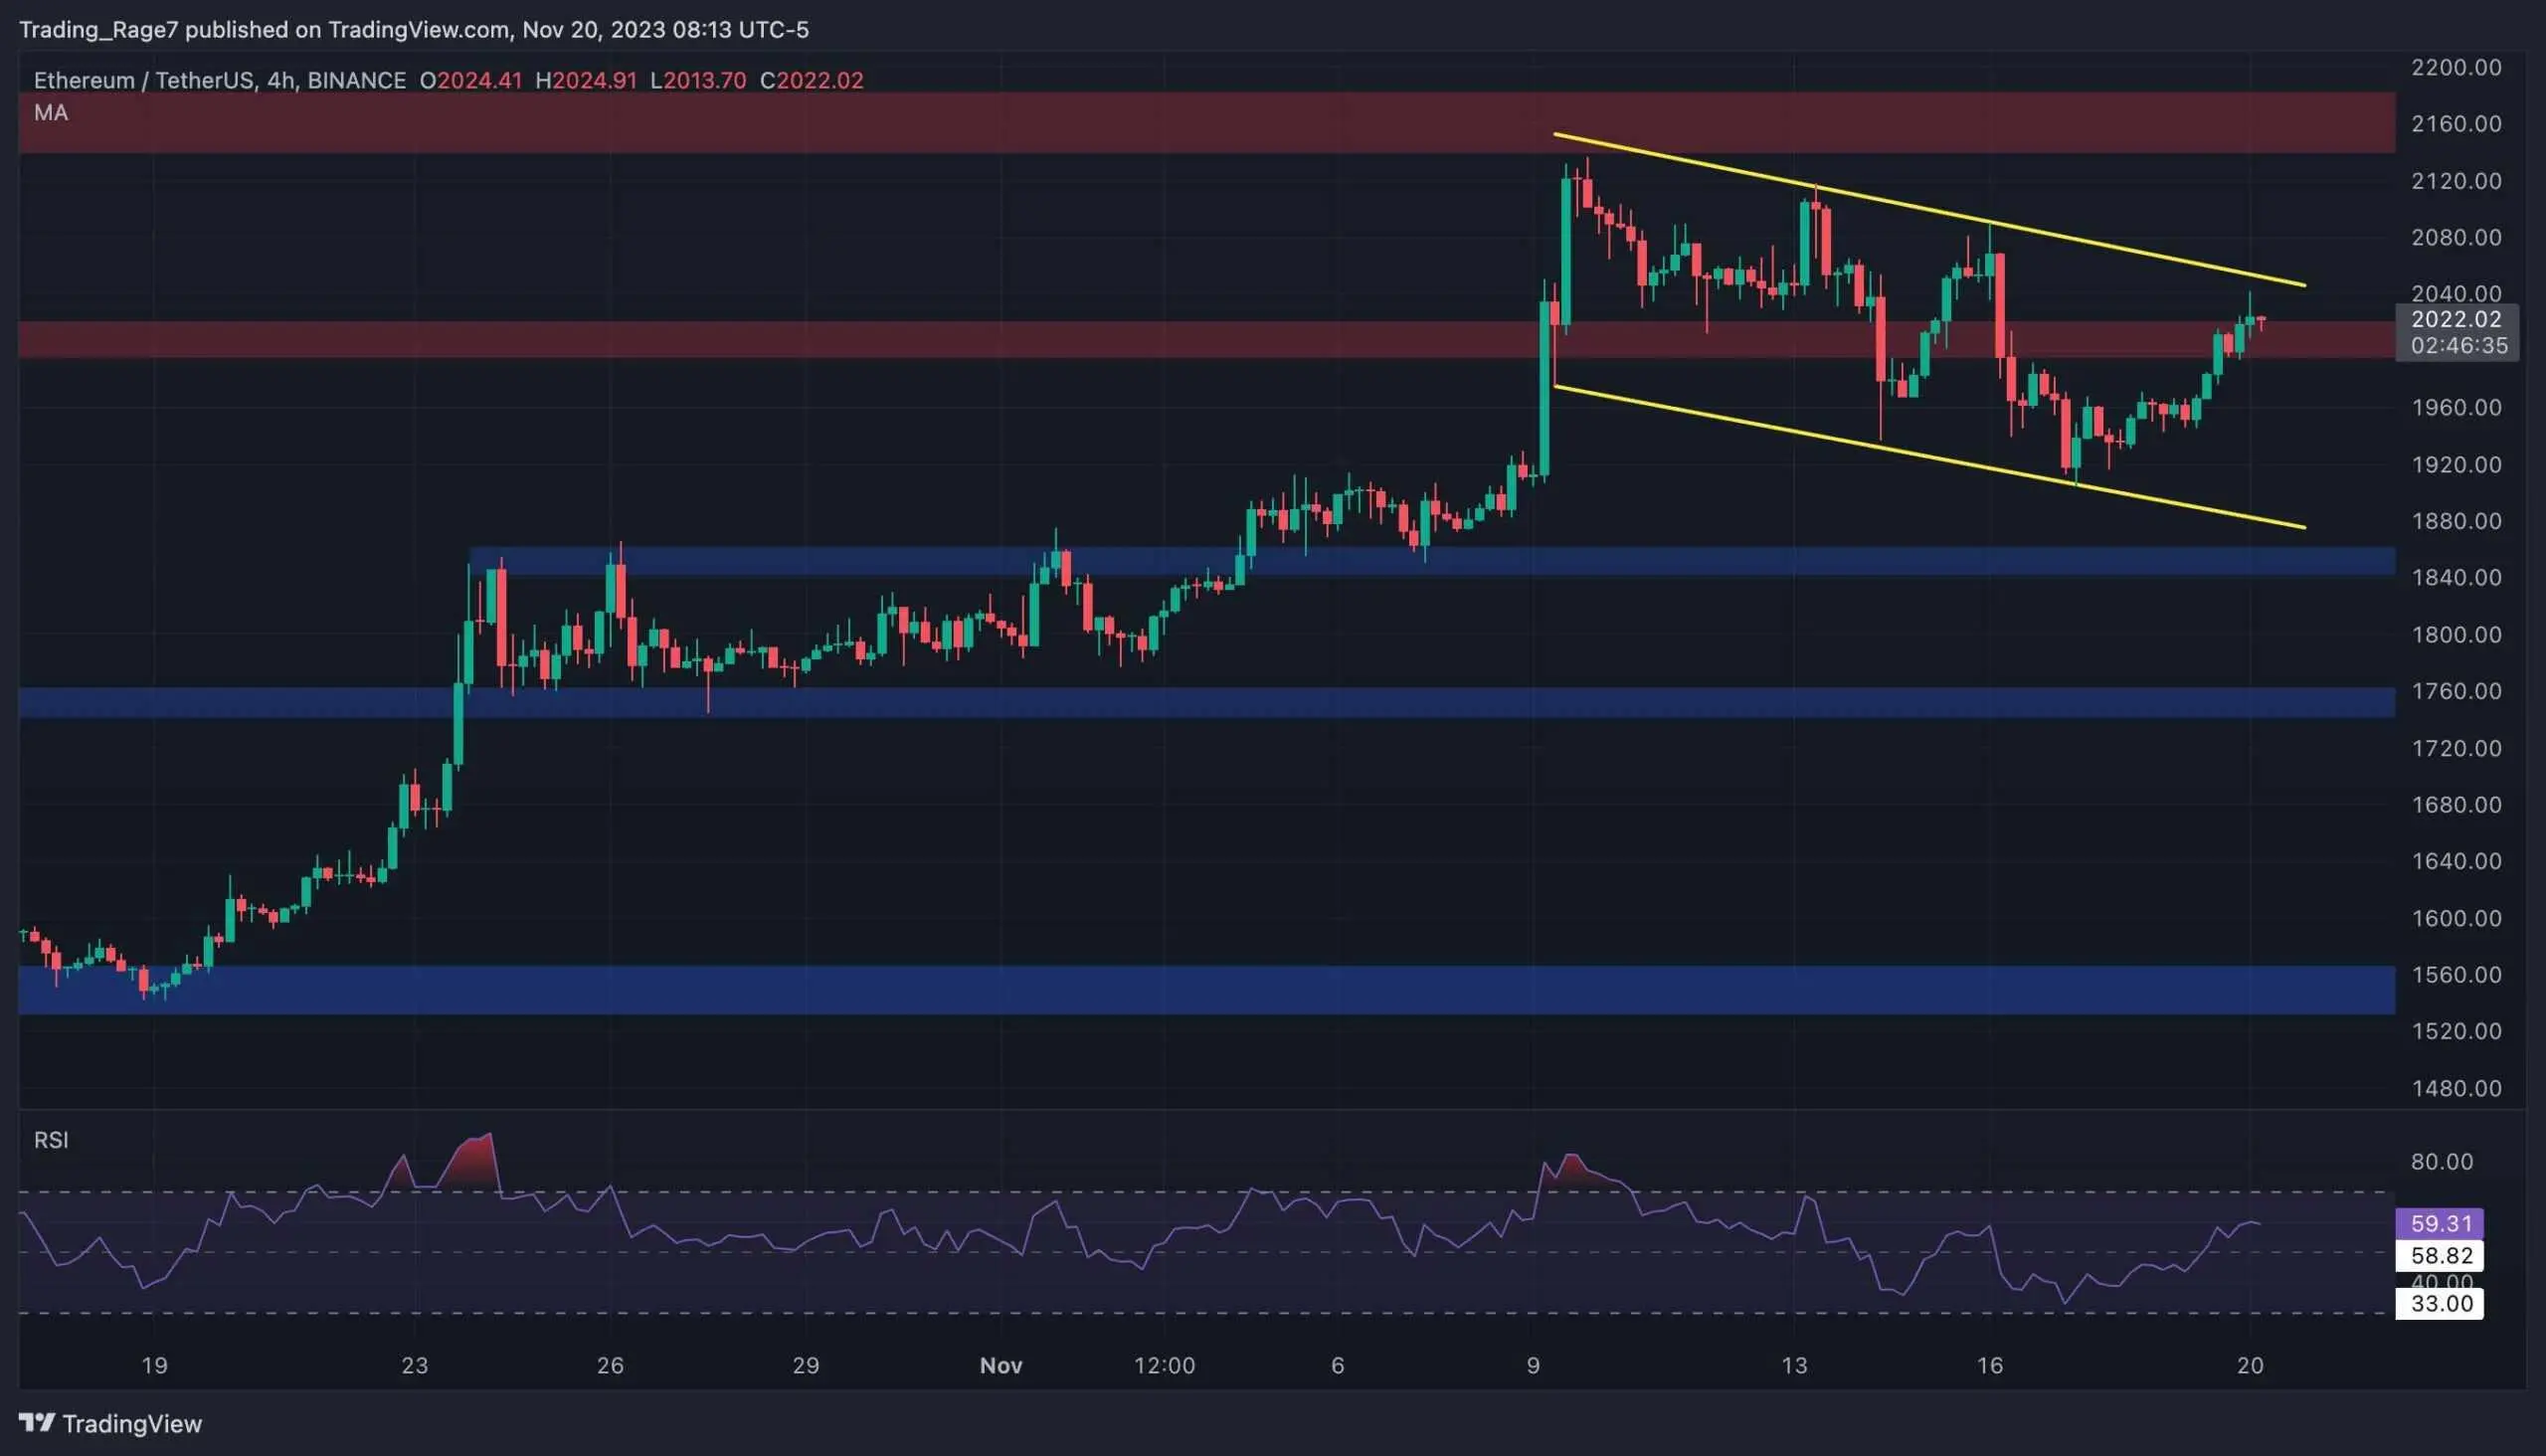
As the 4-hour timeframe depicts, while the market has been trending downward, there is a lack of significant bearish momentum. This can be interpreted from both the Relative Strength Index failing to reach extremely low values as well as the formation of a bullish flag.
The flag is a classic continuation pattern and indicates that the market is likely in a correction phase rather than a complete bearish reversal. In this case, a bullish breakout above the flag would initiate the continuation higher.
Needless to say, if the flag breaks down, things can rapidly get ugly for Ethereum, and a deeper decline could be expected.
 Source: TradingView## Sentiment Analysis
By TradingRage
Funding Rates
Following the recent increase in Ethereum’s price, market participants have become optimistic about the mid-term future of the market. This has led to considerable buying pressure in both the spot and futures markets.
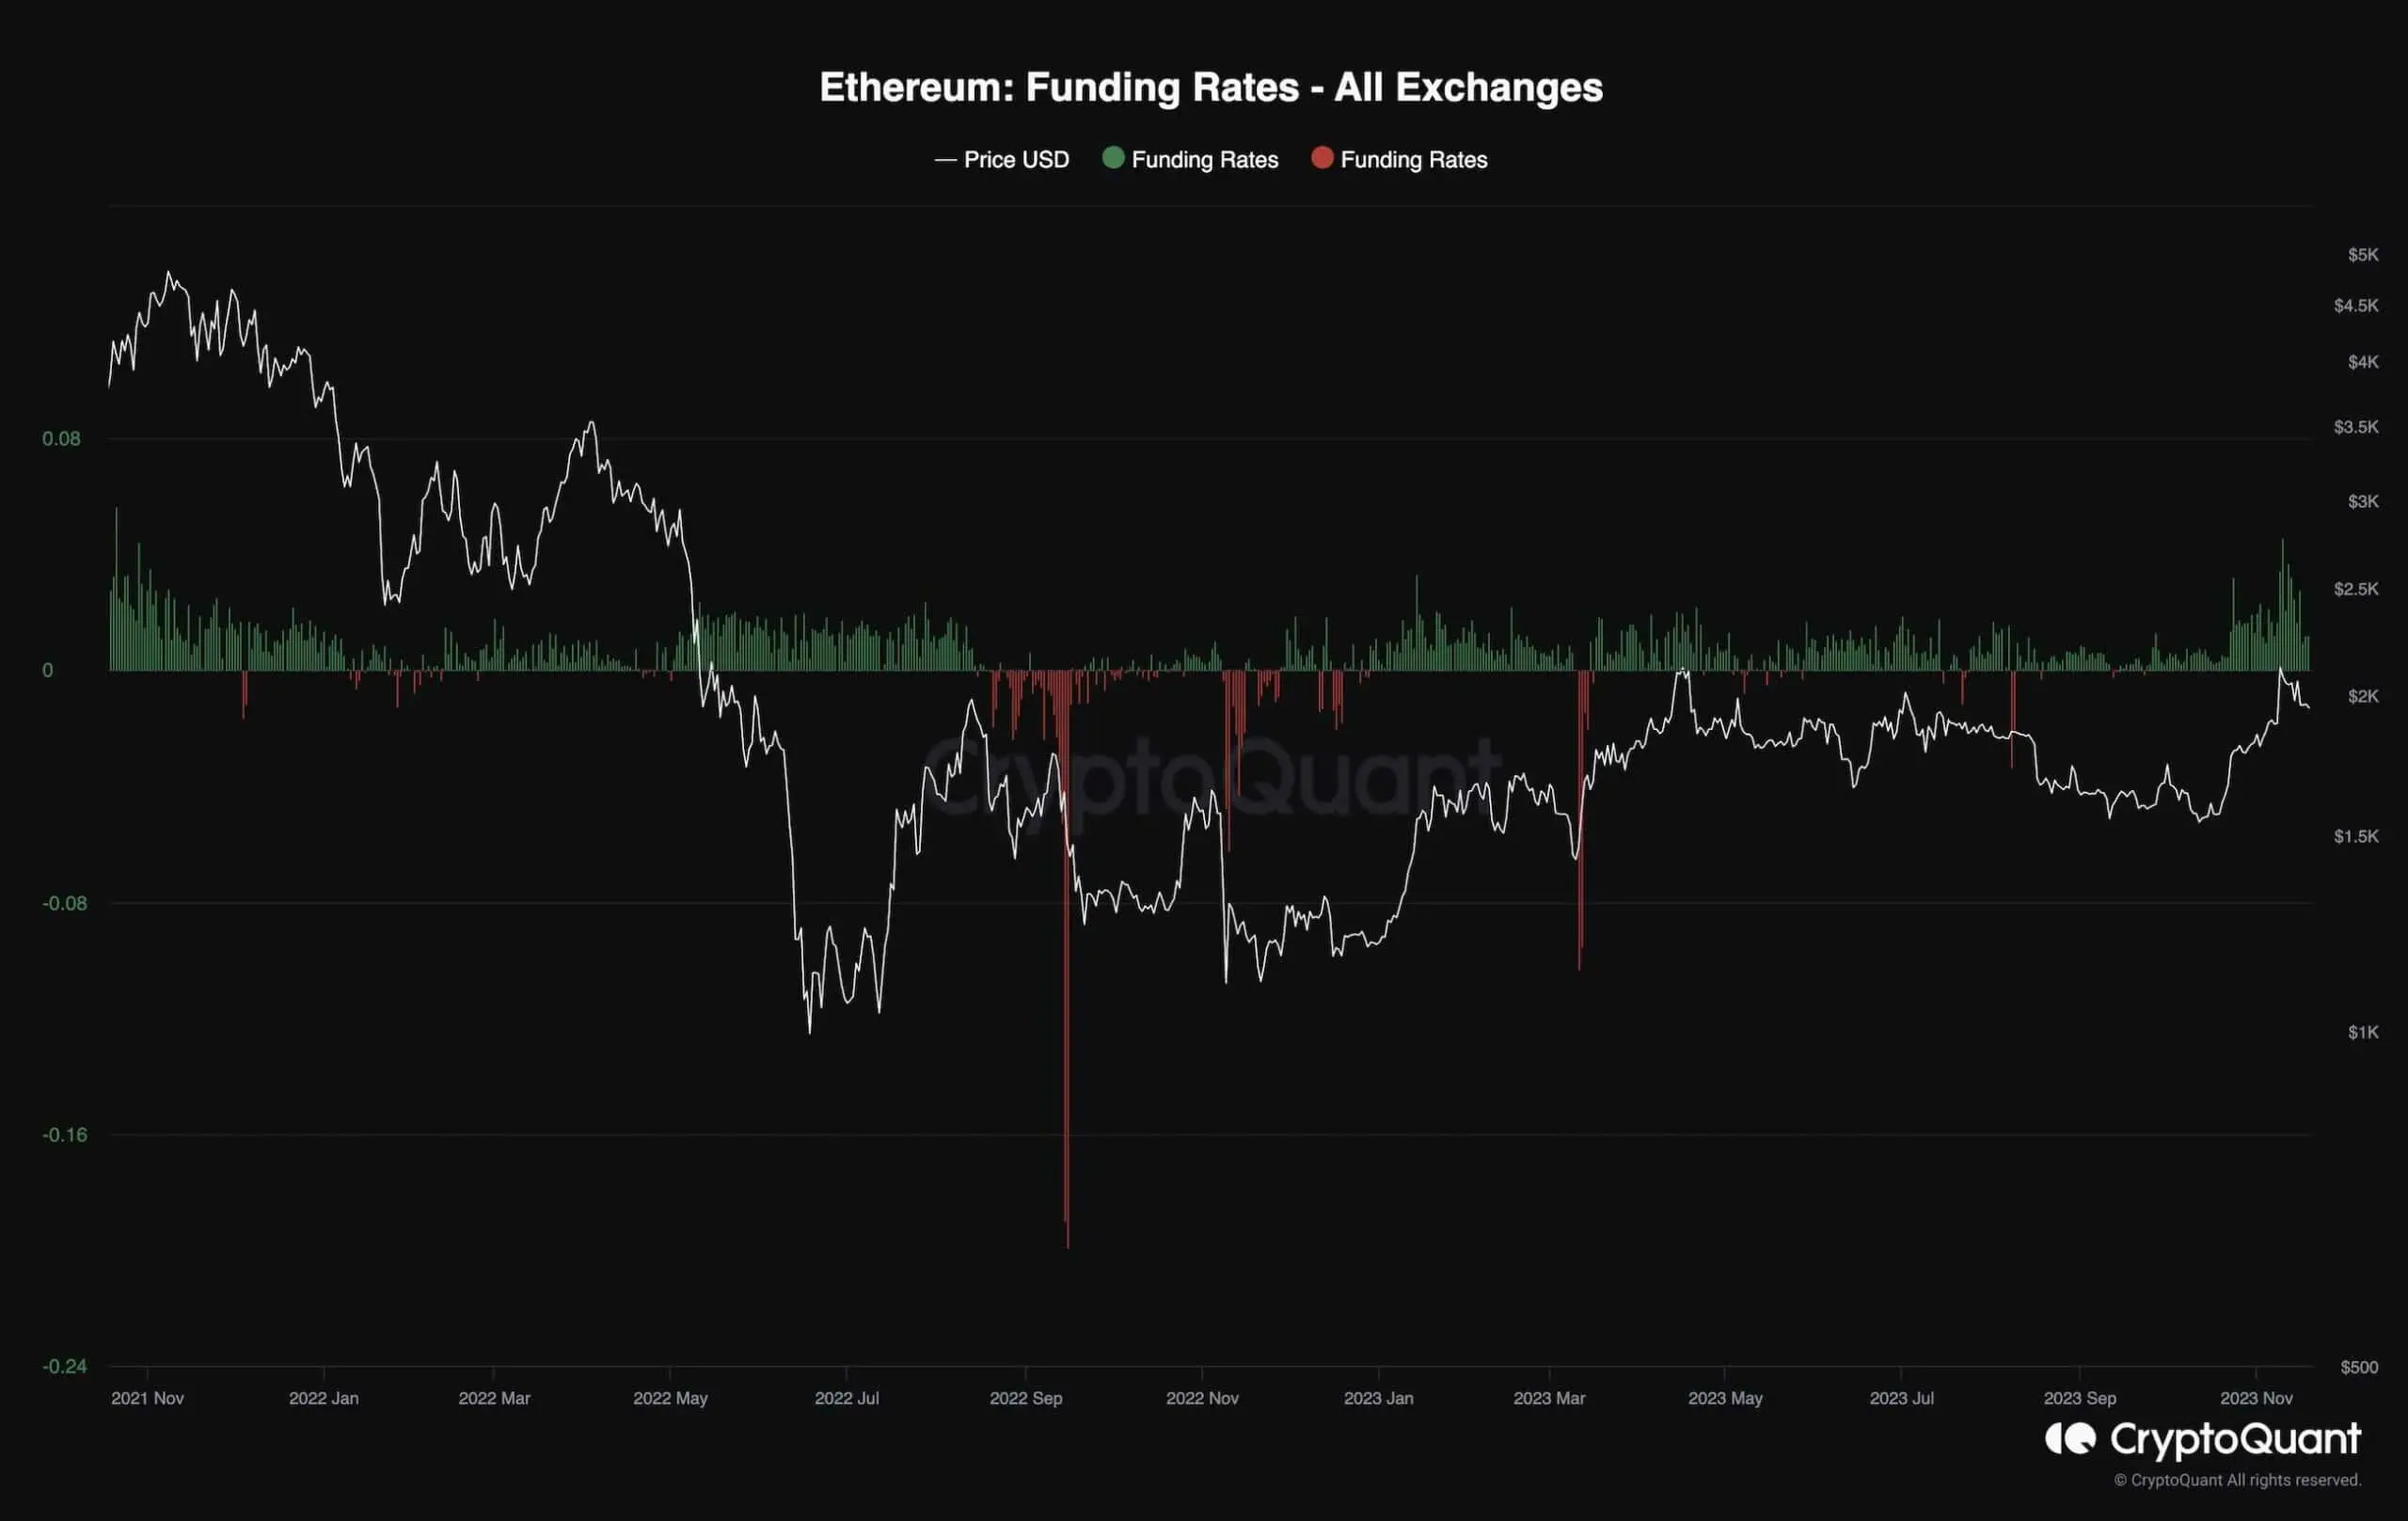
This chart demonstrates the funding rates, which are one of the most insightful metrics when it comes to uating the futures market sentiment. Positive values show bullish sentiment, while negative ones are associated with bearish sentiment.
It is evident that the funding rates have been showing significantly high values over the last few weeks. Meanwhile, a decline has recently started with the correction in price. Extremely positive funding rates are typically witnessed when the price reaches a high and is about to pull back or reverse.
The reason for this phenomenon is that with high funding rates, the risk for a long liquidation cascade increases drastically. As a result, investors should be cautious as the recent drop in price might be the beginning of a larger bearish phase.
 Source: CryptoQuant