Markets are on bull activity today, with the global market cap sitting 4% above its previous 24-hour mark, as the total cap stands at $1.61T as of press time. The fear and greed index is 73, as greed continues fading. The global trading volume is 12% down in 24 hours, at $69.3B as of press time
Bitcoin Price Analysis
However, Bitcoin (BTC) is riding on bull activity, as the Bitcoin price stood at $42.8K as of press time after recording a daily increase of 4% and a weekly drop of 2.5%. As a result of the Bitcoin price, the token’s trade volume dropped by 0.38% during the same period and is presently at $24.7B.
The Bollinger bands are far apart, showing high volatility levels on the Bitcoin price. The Relative Strength Index (RSI) is below the average line, showing bear activity on the Bitcoin price despite the rise.
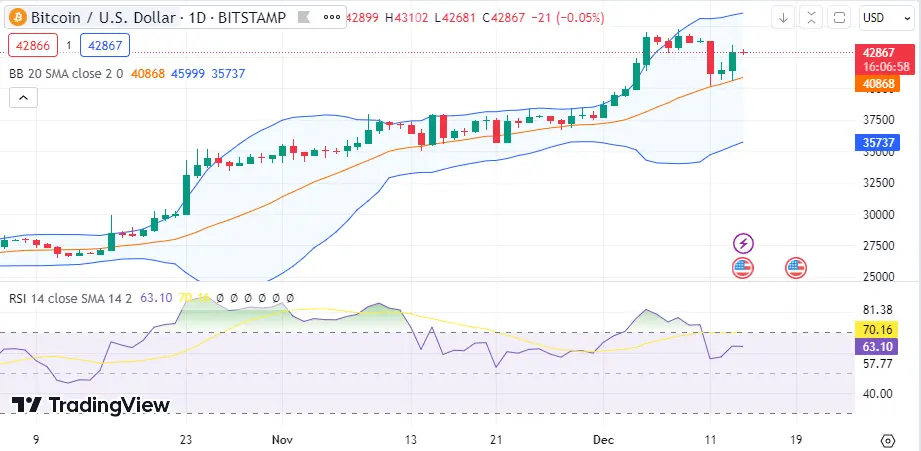 BTC 1-day chart | Souce: TradingView## Ethereum Price Analysis
Ethereum (ETH) is also riding on bull activity, as the Ethereum price stood at $2,278 as of press time after recording a daily increase of 4.9% and a weekly rise of 0.74%. As a result of the Ethereum price, the token’s trade volume dropped by 8% during the same period and is presently at $11.2B.
The Bollinger bands are far, showing high volatility levels on the Ethereum price. The Relative Strength Index (RSI) is below the average line, showing bear activity on the Ethereum price despite today’s rise.
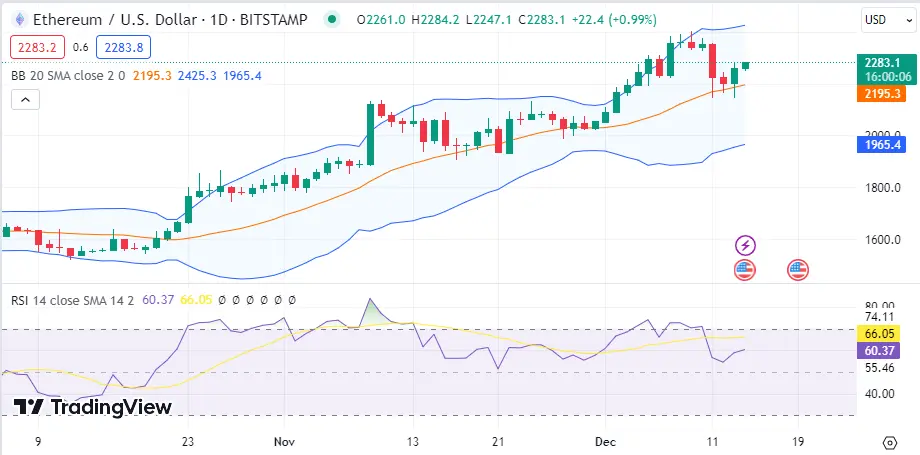 ETH 1-day chart | Souce: TradingView## Cosmos Price Analysis
Cosmos (ATOM) is also riding on bull activity, as the Cosmos price stood at $11.26 as of press time after recording a daily increase of 2% and a weekly rise of 13%. As a result of the Cosmos price, the token’s trade volume dropped by 58% during the same period and is presently at $324M.
The Bollinger bands are diverging, showing high volatility levels on the Ethereum price. The Relative Strength Index (RSI) is above the average line, showing bull dominance on the Cosmos price. However, this price could soon drop as the RSI heads South showing bear action.
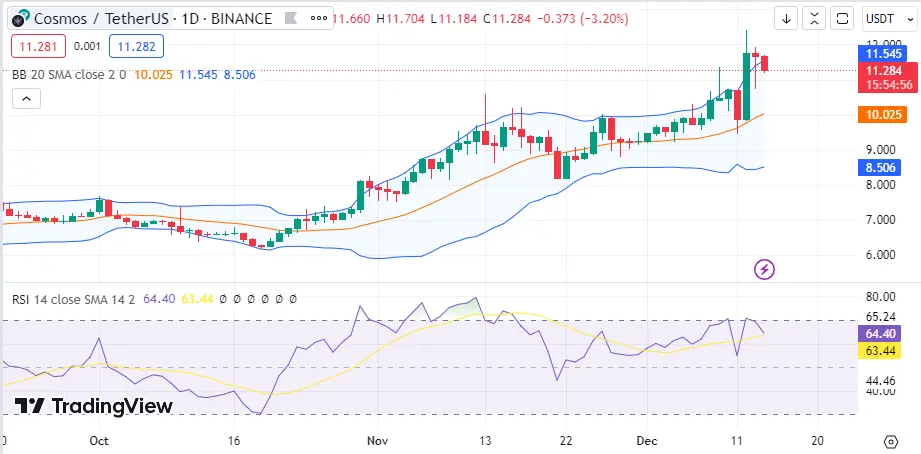 ATOM 1-day chart | Souce: TradingView## Osmosis Price Analysis
Osmosis (OSMO) is also riding on bull activity, as the Osmosis price stood at $1.12 as of press time after recording a daily increase of 10% and a weekly rise of 49%. As a result of the Osmosis price, the token’s trade volume dropped by 55% during the same period and is presently at $42M.
The Bollinger bands are diverging, showing high volatility levels on the Osmosis price. The Relative Strength Index (RSI) is above the average line in the overbought region, showing bull activity on the Osmosis price.
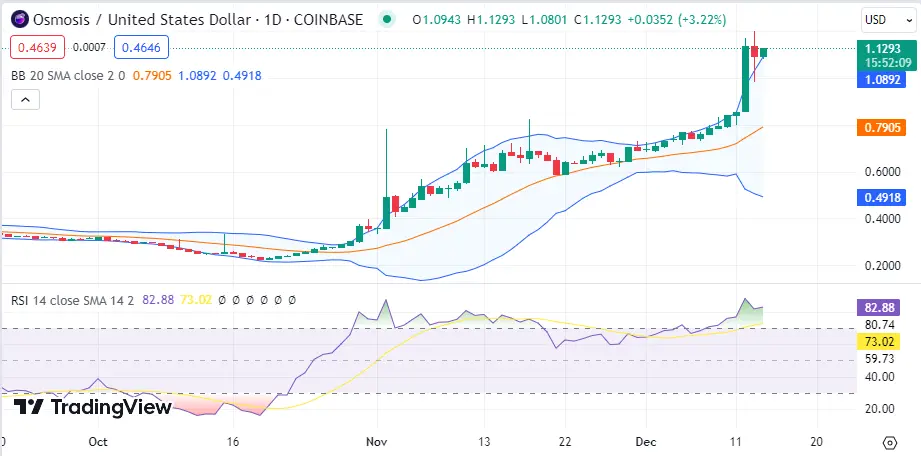 OSMO 1-day chart | Souce: TradingView## Aptos Price Analysis
Aptos (APT) is also riding on bull activity, as the Aptos price stood at $8.42 as of press time after recording a daily increase of 0.73% and a weekly rise of 10.6%. As a result of the Aptos price, the token’s trade volume dropped by 38% during the same period and is presently at $231M
The Bollinger bands are diverging, showing high volatility levels on the Aptos price. The Relative Strength Index (RSI) is below the average line, showing bear activity on the Aptos price despite today’s rise.
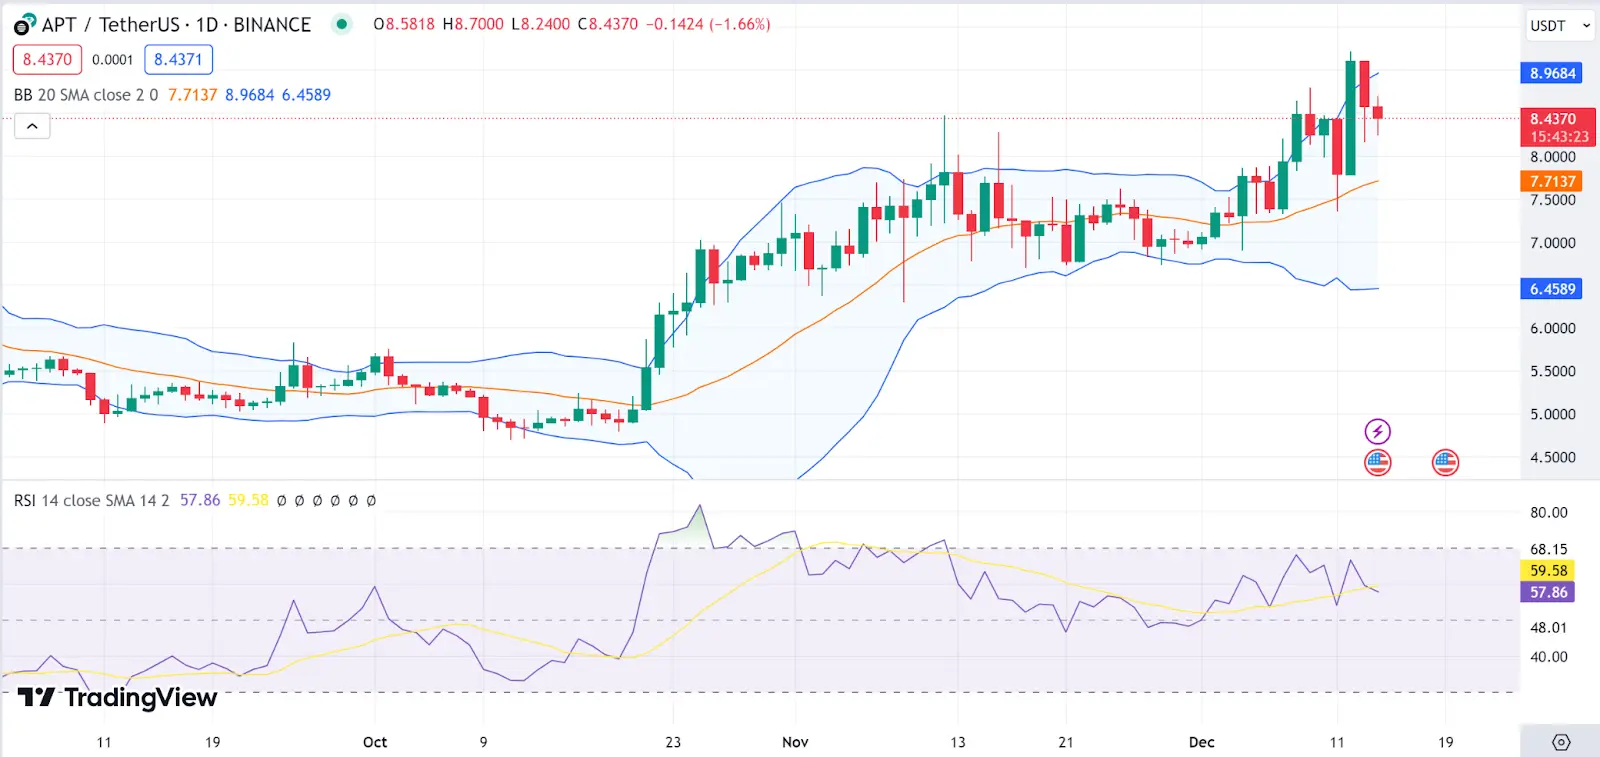 APT 1-day chart | Souce: TradingView
Tuyên bố miễn trừ trách nhiệm: Thông tin trên trang này có thể đến từ bên thứ ba và không đại diện cho quan điểm hoặc ý kiến của Gate. Nội dung hiển thị trên trang này chỉ mang tính chất tham khảo và không cấu thành bất kỳ lời khuyên tài chính, đầu tư hoặc pháp lý nào. Gate không đảm bảo tính chính xác hoặc đầy đủ của thông tin và sẽ không chịu trách nhiệm cho bất kỳ tổn thất nào phát sinh từ việc sử dụng thông tin này. Đầu tư vào tài sản ảo tiềm ẩn rủi ro cao và chịu biến động giá đáng kể. Bạn có thể mất toàn bộ vốn đầu tư. Vui lòng hiểu rõ các rủi ro liên quan và đưa ra quyết định thận trọng dựa trên tình hình tài chính và khả năng chấp nhận rủi ro của riêng bạn. Để biết thêm chi tiết, vui lòng tham khảo
Tuyên bố miễn trừ trách nhiệm.
