Bitcoin’s price has exhibited significant volatility recently, surpassing its previous minor swing high while simultaneously encountering substantial rejection. Nonetheless, the price is approaching a crucial area, with the overall price action signalling a bearish outlook.
Technical Analysis
By Shayan
The Daily Chart
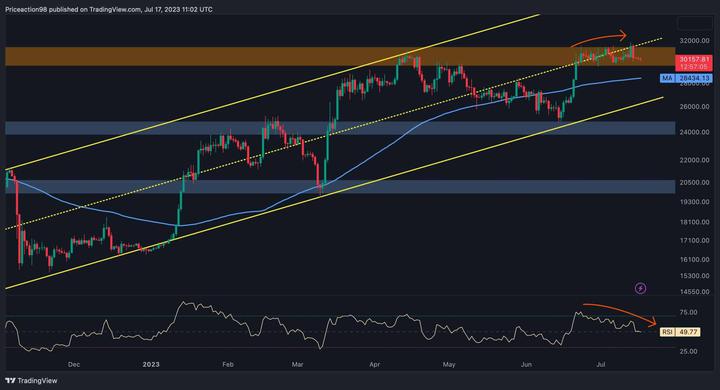
A thorough analysis of Bitcoin’s daily chart reveals the formation of an evident bearish double-top pattern near the major resistance region of $30K. Additionally, the price is facing significant dynamic resistance from the middle-trendline of the ascending channel. It is worth noting that this robust dynamic level has been hindering further price appreciation for several months.
Furthermore, a noticeable divergence between the price and the RSI indicator indicates a shift in the market condition from an uptrend state to a possible downtrend. In case the selling pressure dominates the market, Bitcoin’s next target would be the 100-day moving average situated around the $28K level.
Nonetheless, it seems likely that a rejection from the substantial resistance at $30K is imminent based on Bitcoin’s recent price action.
 Source: TradingView### The 4-Hour Chart
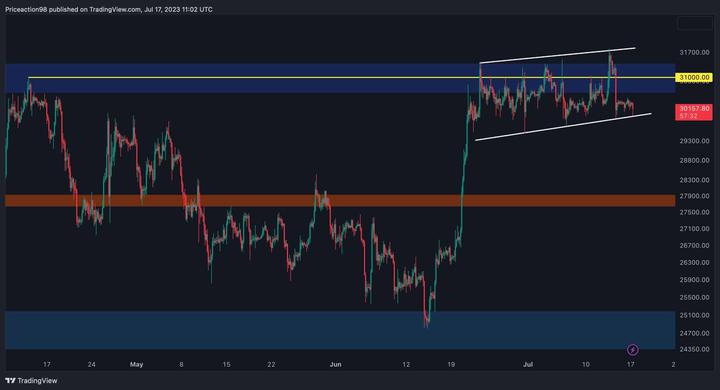
The 4-hour chart demonstrates that Bitcoin’s price has entered an extended consolidation range following its arrival at the important price zone of $30K. Notably, this critical price range aligns with Bitcoin’s previous significant swing high, developed on April 14th, which has served as strong resistance due to increased supply.
Meanwhile, the price has formed an ascending wedge pattern, typically indicating a potential reversal. Most recently, the price experienced a sharp surge, reaching the upper boundary of the wedge, only to face rejection and undergo a rapid decline. However, a break below the lower edge of the wedge suggests the possibility of a mid-term reversal.
Ultimately, in the event of a rejection, Bitcoin’s next target would be the static support region around $28K.
 Source: TradingView## On-chain Analysis
By Shayan
Bitcoin’s price has been volatile, especially after a significant upward surge that brought it close to the crucial resistance level of $30K. This surge has sparked substantial speculation regarding Bitcoin’s ability to successfully break through this resistance barrier. It is advisable to closely examine the futures market to gain valuable insights into the overall market sentiment.
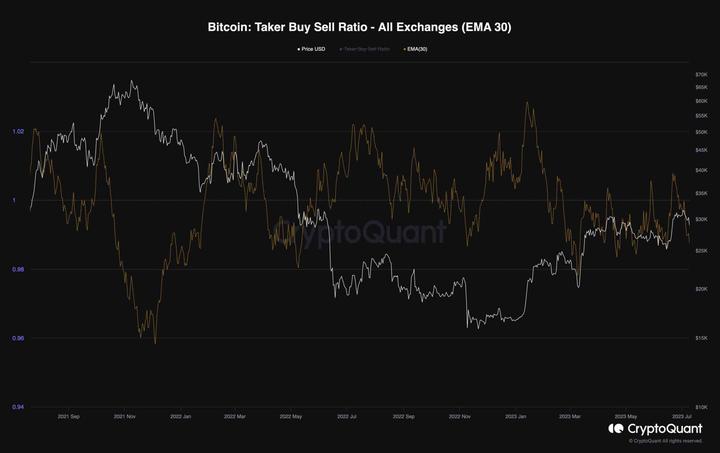
The provided chart illustrates the Bitcoin taker buy-sell ratio, which serves as an essential indicator of the intensity of long and short positions.
Lately, this particular metric has been fluctuating consistently below 1, following a sharp decline. However, there have been no signs of recovery thus far. This signifies that futures traders predominantly maintain a pessimistic outlook on Bitcoin, with their short positions potentially pushing downward pressure on the price in the short term.
 Source: CryptoQuant
Tuyên bố miễn trừ trách nhiệm: Thông tin trên trang này có thể đến từ bên thứ ba và không đại diện cho quan điểm hoặc ý kiến của Gate. Nội dung hiển thị trên trang này chỉ mang tính chất tham khảo và không cấu thành bất kỳ lời khuyên tài chính, đầu tư hoặc pháp lý nào. Gate không đảm bảo tính chính xác hoặc đầy đủ của thông tin và sẽ không chịu trách nhiệm cho bất kỳ tổn thất nào phát sinh từ việc sử dụng thông tin này. Đầu tư vào tài sản ảo tiềm ẩn rủi ro cao và chịu biến động giá đáng kể. Bạn có thể mất toàn bộ vốn đầu tư. Vui lòng hiểu rõ các rủi ro liên quan và đưa ra quyết định thận trọng dựa trên tình hình tài chính và khả năng chấp nhận rủi ro của riêng bạn. Để biết thêm chi tiết, vui lòng tham khảo
Tuyên bố miễn trừ trách nhiệm.
