Highlights
①. Gate's "Basic Futures Contracts" course introduces various methods of technical analysis that are commonly employed in futures trading. The aim of these courses is to help traders establish a comprehensive framework for technical analysis. Covered topics include the basics of Candlestick charts, technical patterns, moving averages, trend lines, and the application of technical indicators.
②. In Course XV of the "Master Technical Analysis" series, we introduce you to a flag pattern, including its significance, meaning, features and application in trading.
1. What is a flag?
The flag pattern typically emerges during market consolidations within long-term uptrends or downtrends. It seldom appears at the peak of a bull market or the trough of a bear market. Flags can be classified into two types: bullish and bearish flags.
In most instances, the flag's formation is due to price oscillations. The appearance of this pattern often suggests that the prevailing trend will resume after brief consolidations. Specifically, a bullish flag is usually followed by an upward trend, while a bearish flag often precedes a price decline.
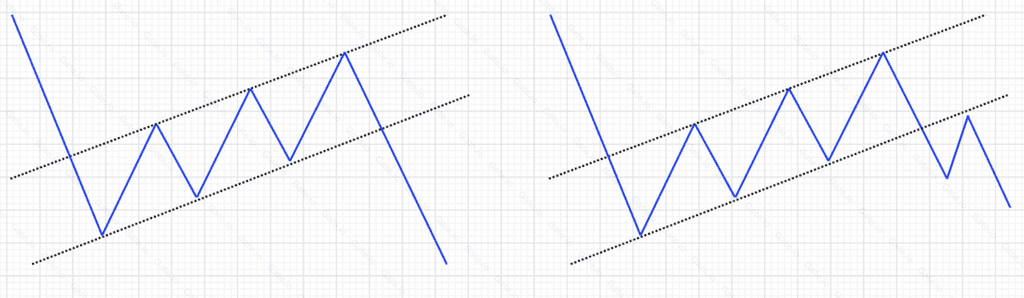
The name "flag" is derived from the pattern's visual resemblance to a flag fluttering on a flagpole, as illustrated in the picture below:
①.Bullish flag
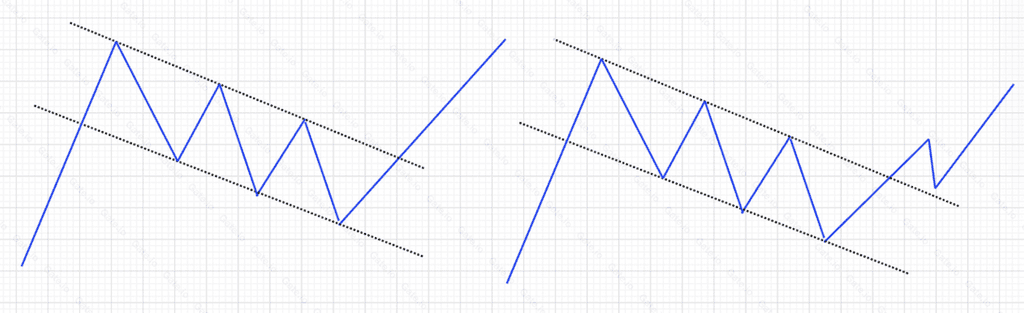
②.Bearish flag
2. Features of flag
Bullish flag
①. Appears in an upward trend;
②. The price first surged, forming the flagpole. Then, it starts to fluctuate within a certain range. Connecting the high and low of the oscillation range, two parallel lines are formed, constituting the flag's body.
③. As price moves from the flagpole to the flag body, the trading volume decreases step by step.
Bearish flag
①. Appears in a downward trend;
②. The coin price first falls sharply along a near-vertically angled slope, forming a flagpole. Then, it starts to rebound, consolidating gently within a range that slightly inclines upwards. By connecting the high points to high points of the oscillation range, two parallel lines can be drawn, forming the body of the flag pattern;
③. The trading volume significantly decreases during the formation of the flag pattern.
3. Technical meanings
When the upper edge of a bullish flag is breached, it signals the potential for a bullish market and suggests a buying opportunity. Conversely, when the lower edge of a bearish flag is broken, it indicates the potential for a bearish market, suggesting a selling opportunity.
4. Appllication
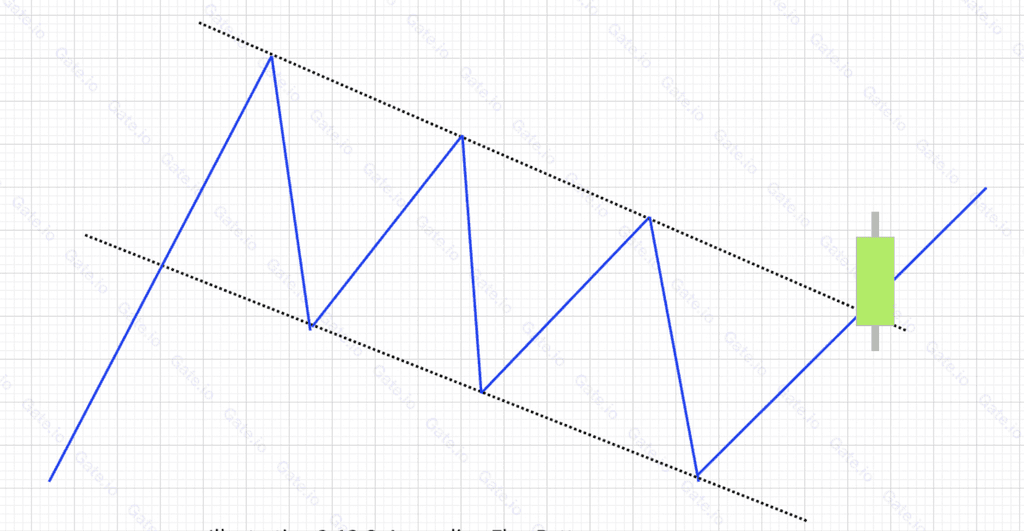
①. When the upper edge of a bullish flag is breached, it indicates potential for a bullish market and suggests a buying opportunity. The illustration below highlights the position of this trading opportunity.
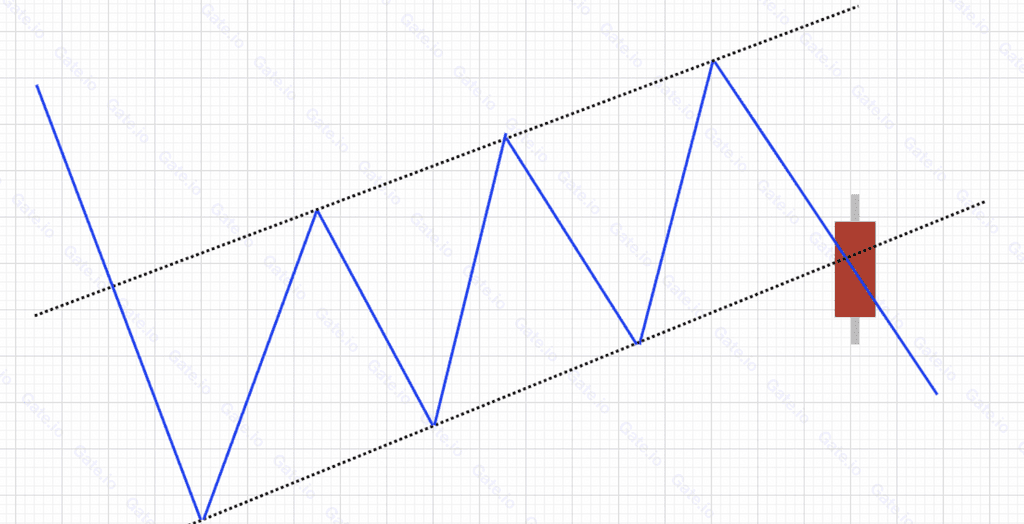
②. When the lower edge of a bearish flag is breached, it indicates potential for a bearish market, suggesting a selling opportunity. The illustration below highlights the position of this trading opportunity.
5. Use Case
①. Bullish flag
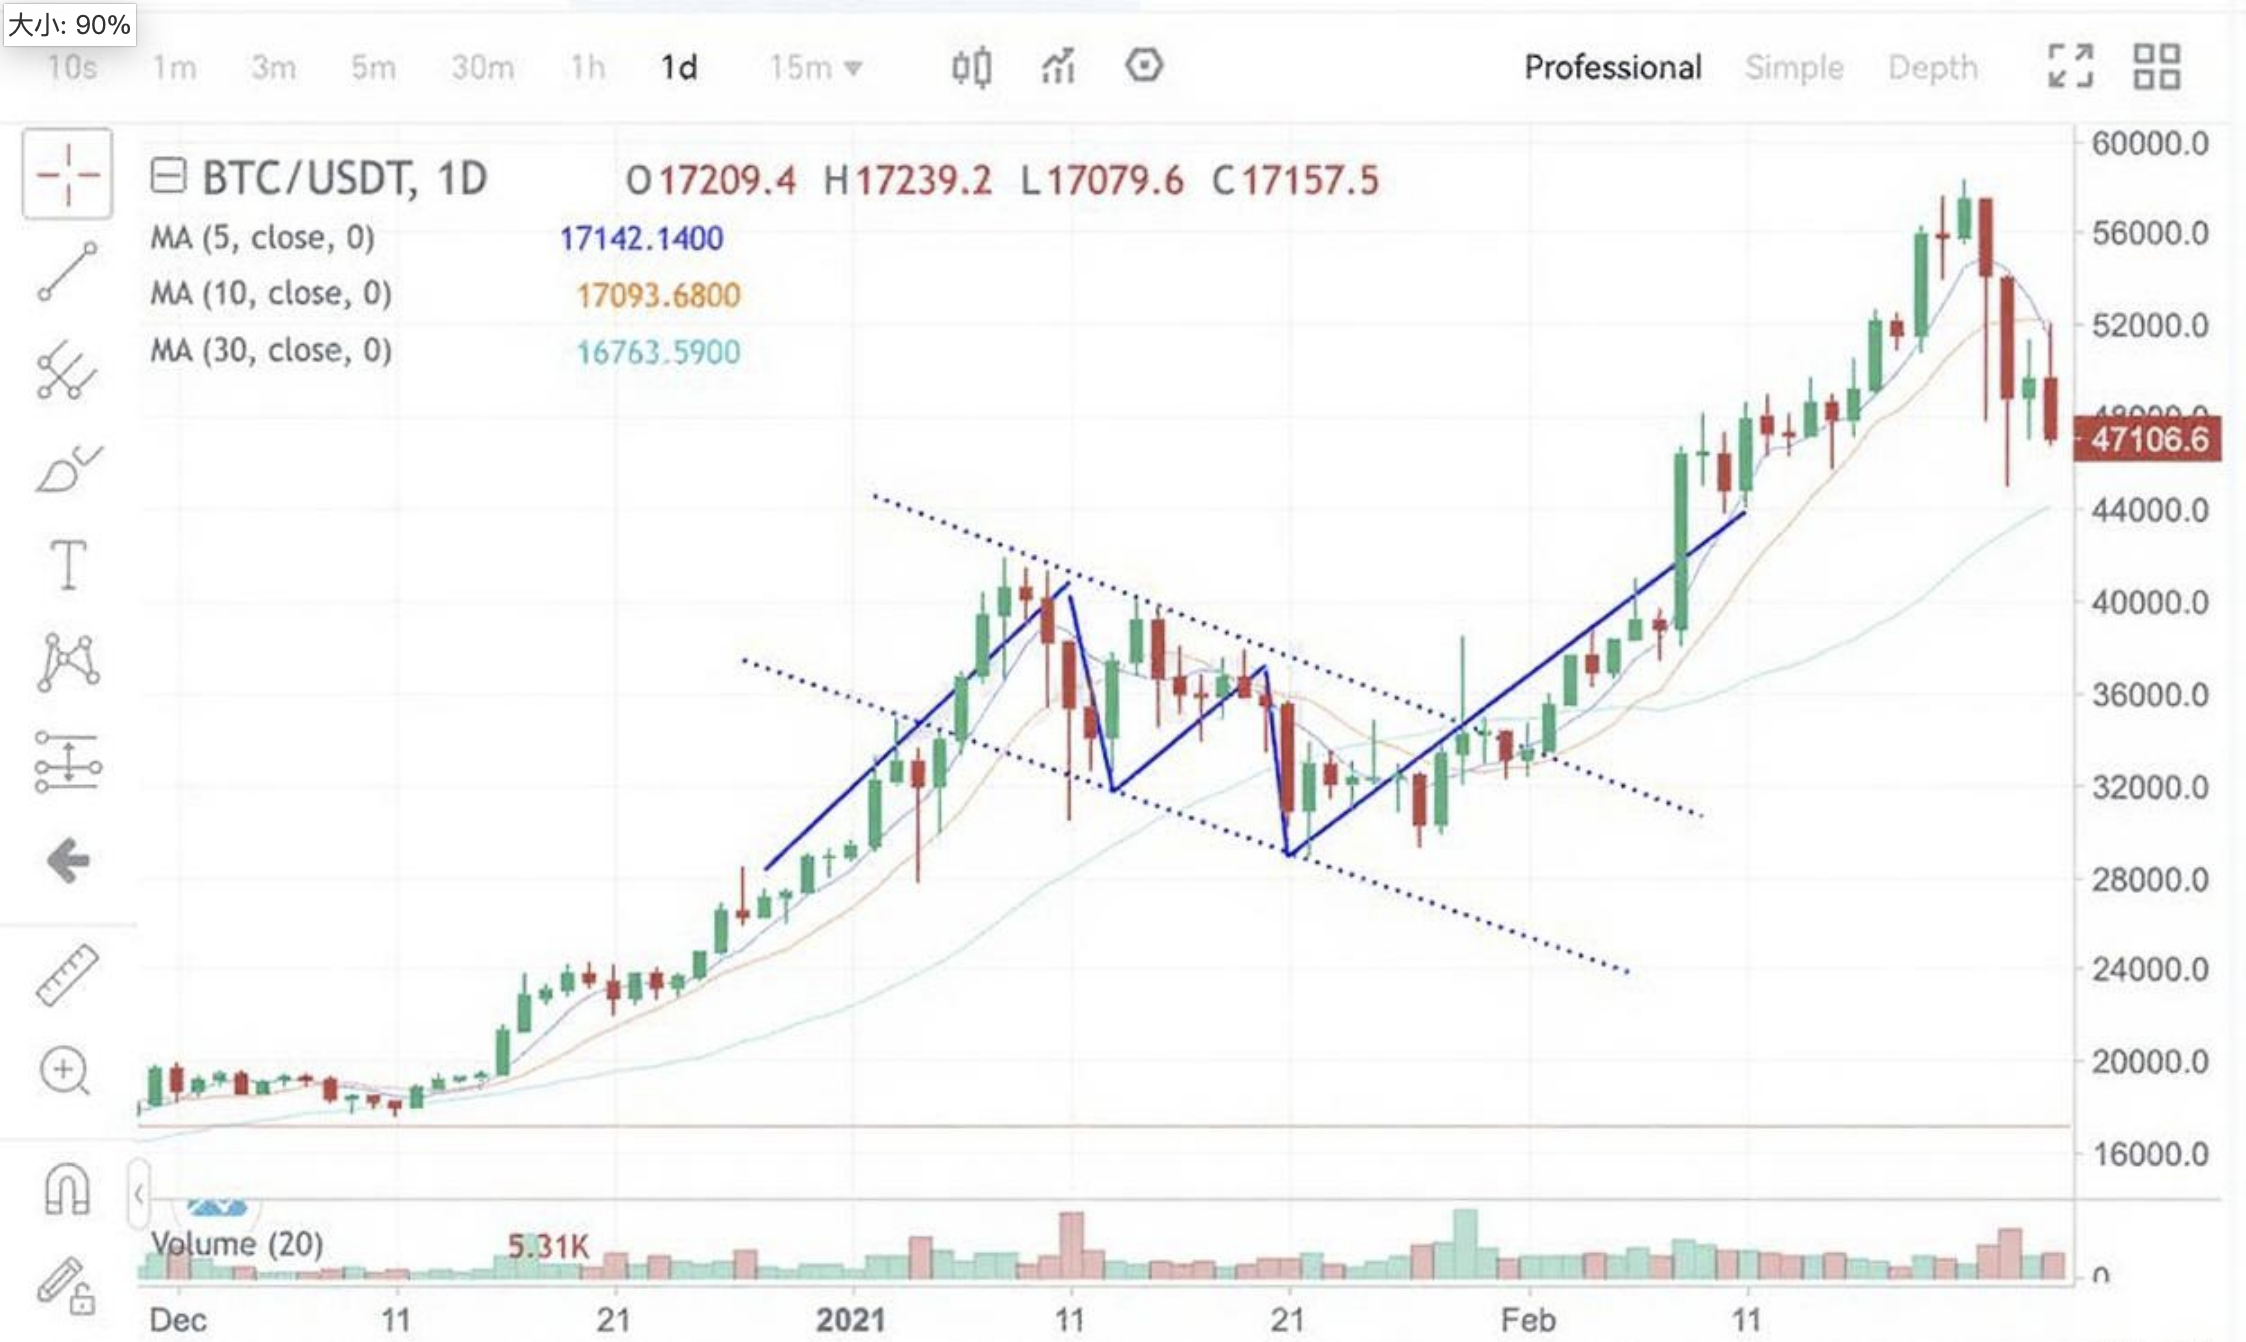
The chart above represents the BTC/USDT daily chart on Gate, spanning from January 1, 2020, to February 28, 2020. Amid a robust uptrend, BTC soared from $10,000 to a peak of around $41,000. It then entered a consolidation phase, oscillating between $29,000 and $41,000. During this period, it sculpted a bullish flag pattern. Subsequently, propelled by a strong upward momentum, the coin price breached the flag's upper boundary at $36,000. This led to another significant bullish surge, culminating in a peak of $64,000.
②. Bearish flag
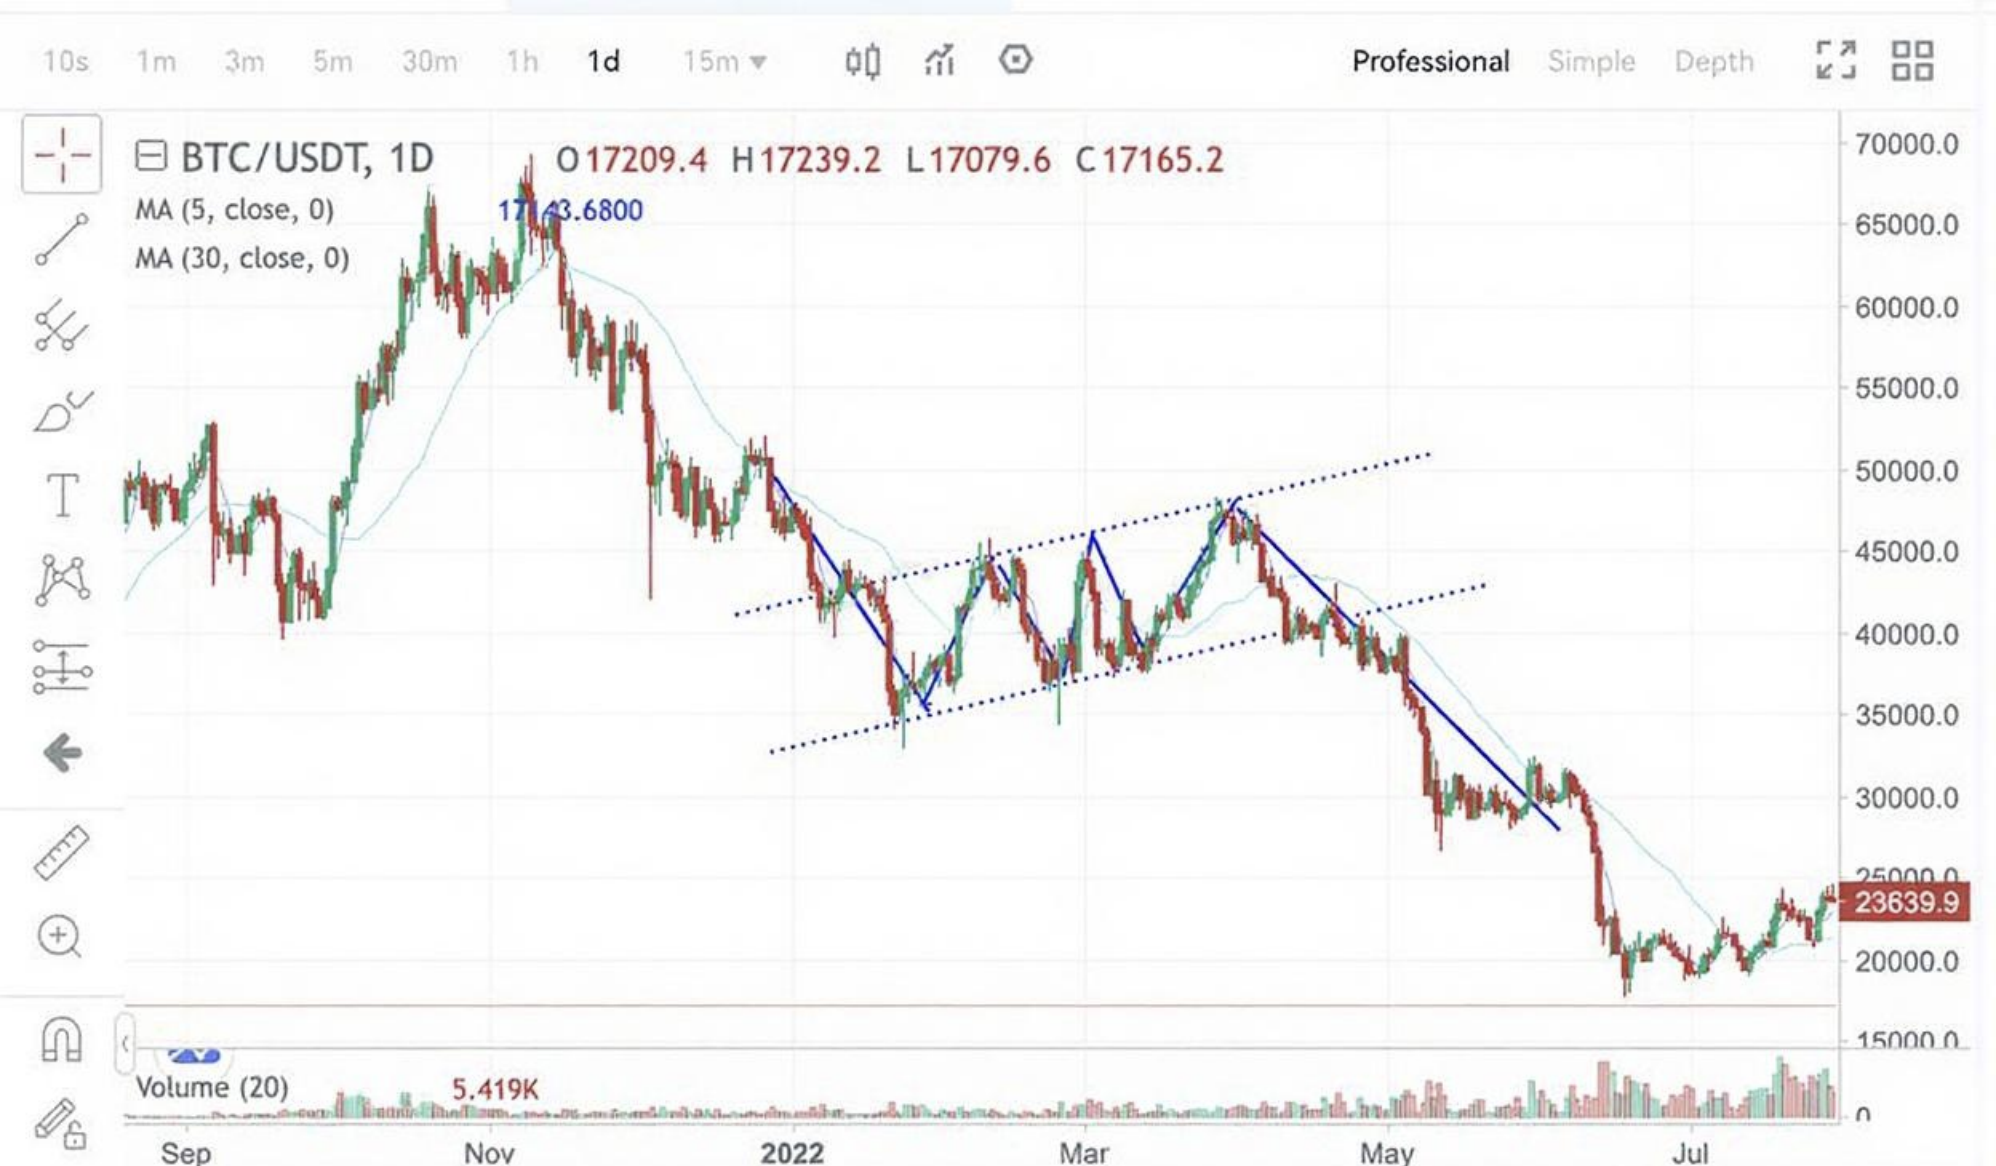
The chart above displays the Gate BTC/USDT daily chart, covering the period from December 28, 2020, to May 13, 2021. BTC experienced a dramatic plunge, falling from $69,000 to $33,000 in an overwhelming manner. Subsequently, the price began oscillating between $33,000 and $45,000, gradually forming a bearish flag pattern. When the coin price broke below the flag's lower edge at $40,000, it initiated a strong downward trend, eventually hitting a low of $17,000.
6. Summary
Flags form exclusively during periods of sharp market ascents or steep declines. It's crucial to note that a breakthrough at the upper edge of a bullish flag is considered a legitimate signal only when accompanied by an increase in trading volume. Without this concurrent rise in volume, the breakout might be deceptive or false.
Start trading futures by registering on Gate Futures.

Disclaimer
This article is for informational purposes only and does not constitute investment advice. Gate is not responsible for any investment decisions you make. Content related to technical analysis, market assessments, trading skills, and traders' insights should not be considered a basis for investment. Investing carries potential risks and uncertainties. This article offers no guarantees or assurances of returns on any type of investment.
Disclaimer
The content provided herein is for reference and educational purposes only and does not constitute any financial, investment, trading, or legal advice, nor does it constitute an offer or solicitation to buy or sell any digital assets. Gate makes no express or implied representations or warranties regarding the accuracy, completeness, or timeliness of the information contained herein. Product features, interfaces, rules, and fee structures may be updated or adjusted at any time. Please refer to the latest announcements and the actual information displayed on the Gate platform for the most accurate details.
Digital asset investments involve significant risk, and prices may fluctuate substantially. You may lose the entire amount of your investment. Please make decisions cautiously based on your own financial situation and risk tolerance after fully understanding the associated risks. If necessary, you are advised to consult an independent professional financial or legal advisor.
For more information about potential risks, please refer to Gate's Risk Disclosure and User Agreement.
