Highlights
①. Gate's "Basic Futures Contracts" course introduces various methods of technical analysis that are commonly used in futures trading. The aim of these courses is to help traders establish a comprehensive framework for technical analysis. Covered topics include the basics of Candlestick charts, technical patterns, moving averages, trend lines, and the application of technical indicators.
②. This article, as Course VII of the series "Master Technical Analysis", will introduce one key candlestick pattern-double bottoms, and will cover the concept of the pattern, its characteristics, technical meaning, as well as its application in trading.
1. What are double bottoms?
During the bearish run, the downward trajectory of the price halts when it reaches a point where the trading volume begins to contract, evidenced by fewer sell orders being placed. As buy orders accumulate, the market experiences a resurgence, marked by an increase in trading volume.
Shortly after this brief rebound, the price experiences another dip as selling pressure mounts. However, the decline halts at a level approximately equal to the previous low, albeit witnessing a substantially larger decline in trading volume than observed in the preceding trough.
This second low serves as the starting point for a new round of bullish activity, featuring a notably larger surge in trading volume compared to the first rebound. If the price continues to ascend and surpasses the previous high, it signifies the formation of a double bottom pattern.
The technical pattern "double bottom" derives its name from its physical appearance, which features two troughs, and is alternatively referred to as a W-shaped bottom due to its resemblance to the English letter "W.":
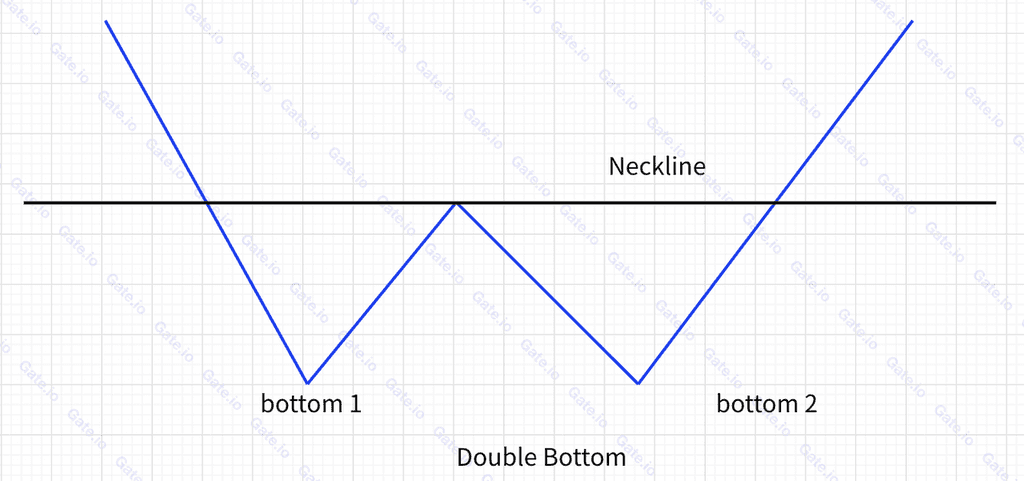
The neckline of the double bottoms refers to the horizontal line that passes the peak of the price wave. The neckline serves as a dividing line that marks the boundary between the sell and buy markets.
2. Technical features of double bottoms
①. It appears at the end of a downward trend or mid-term consolidation;
②. The two troughs are of the same height, or the second one is slightly higher than the first;
③. The trading volume at the second low is generally smaller than that first one, but after passing the second low, the trading volume will generally increase at a faster speed than the first rebound;
④. The neckline generally is a horizontal line that passes through the price peak during the rebound. Sometimes it is slightly tilted due to morphological reasons.
3. Application
The double bottom pattern signals an impending reversal in market trend, indicating that the price has reached its lowest point and is poised for a rebound. Thus, the formation of this pattern provides a cue for asset purchasing. Below is an example illustrating the use of this pattern in trading:
①. Usage case
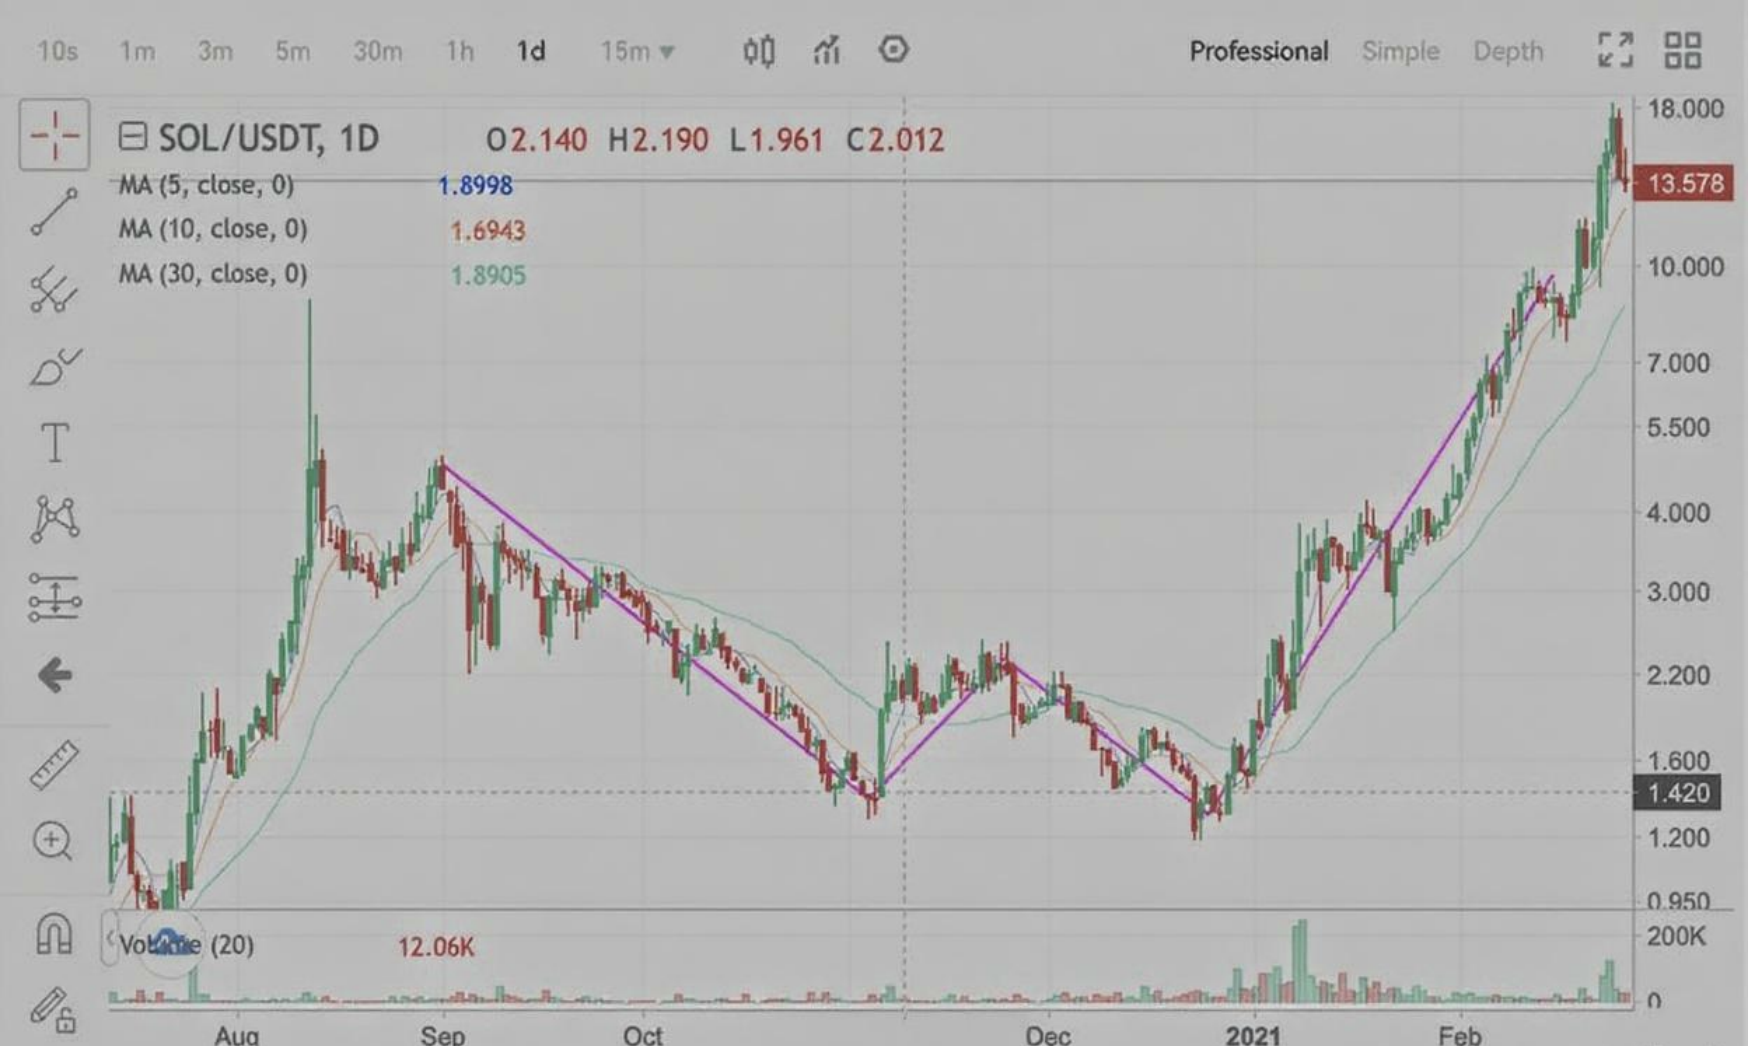
The chart above depicts the daily candlestick for the SOL/USDT futures pair on Gate. From September 1, 2020, to November 4, 2020, SOL plummeted from a peak of 4.5u to a trough of 1.28u, experiencing a cumulative decrease of 72.8%. After bottoming out at 1.28u, it reversed direction, climbing to 2.4u. However, as more traders sold their assets to capitalize on the bullish trend, the price plunged again, approximately to 1.2u. Evidently, a double bottom pattern essentially formed, subsequent to which the market welcomed a vigorous bullish surge.
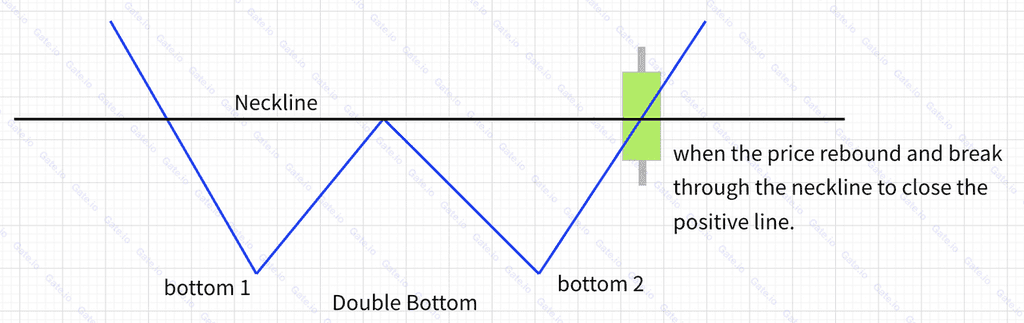
②. Buying Opportunity 1: The initial buying opportunity presents itself just prior to the formation of the double bottoms. Specifically, this refers to the point when the escalating price decisively breaches the neckline, forming a large green candle on that day. Such a breakthrough signifies a high likelihood of entering a bull market. Below is an illustration depicting the position of the first buying signal:
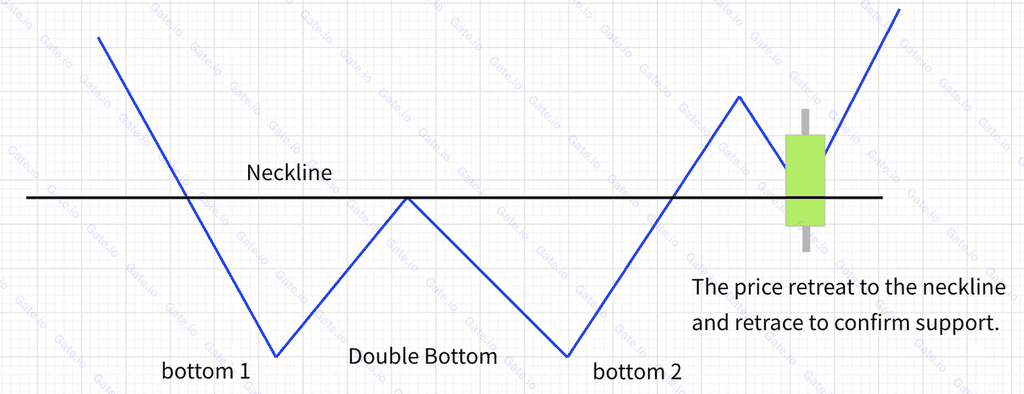
③.Buying Opportunity 2: The second buying opportunity emerges following the formation of the pattern. After the price breaks through the neckline, it experiences an ascension for a period before encountering a downturn. Subsequently, upon touching the neckline, it reverses direction, adopting a bullish stance once more. The moment when the descending price makes contact with the neckline constitutes the second opportunity to purchase assets. Below is an illustration indicating the position where the second buying opportunity arises:
④. Buying Opportunity 3: Another buying opportunity arises during the price ascent after it finds support at the neckline. If the price continues to climb, surpassing the previous high, this presents a potential buying point. Below is an illustration depicting the position where the third buying opportunity is located:
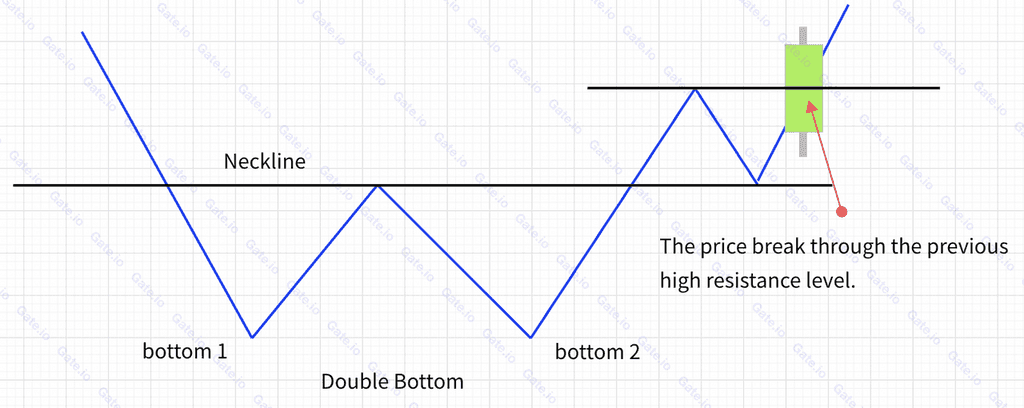
In summary, the initial step involves drawing the neckline by establishing a horizontal line that traverses the peak of the price wave. Subsequently, observe the price movement to confirm three buying points, particularly if the bullish ascent breaches the neckline, accompanied by the formation of a green candlestick:
a. Buying opportunity I: when the rising price breaks up the neckline ;
b. Buying opportunity II: at the confirmation of the neckline after the price breaks up the neckline;
c. Buying opportunity III: After the price hits the neckline and rises again, there will be a third opportunity if the price increases to surpass the previous high.
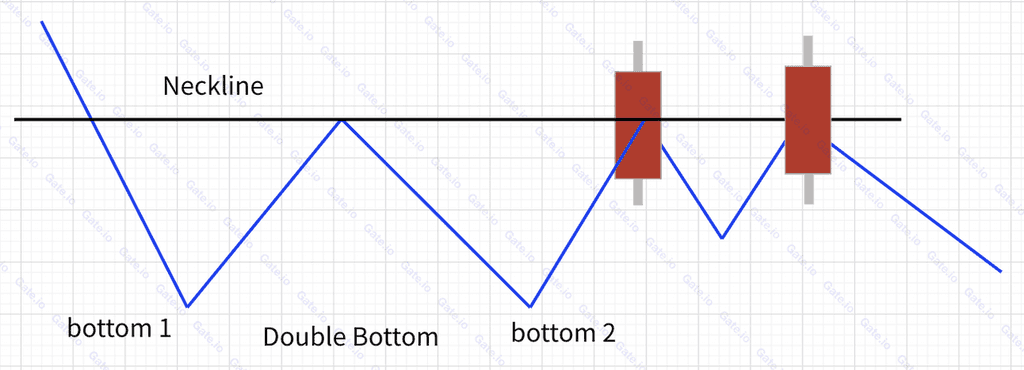
4. Invalid double bottoms
The formation of a double bottom does not guarantee an ensuing bullish market. For instance, if, after the price breaks through the neckline, the neckline confirmation fails—meaning the price falls below the neckline again—this can signal a significant market decline, as indicated in the chart below. In such a scenario, the suggested actions, signaled by this downturn, are to close positions and sell.
Summary
The 'Dow Theory' serves as the cornerstone of the comprehensive technical analysis system, and comprehending it is essential to mastering various technical analysis skills. The double bottom pattern also represents an application of Dow Theory in trend analysis.
Start trading futures by registering on Gate Futures.

Disclaimer
This article is for informational purposes only and does not constitute investment advice. Gate is not responsible for any investment decisions you make. Content related to technical analysis, market assessments, trading skills, and traders' insights should not be considered a basis for investment. Investing carries potential risks and uncertainties. This article offers no guarantees or assurances of returns on any type of investment.
Disclaimer
The content provided herein is for reference and educational purposes only and does not constitute any financial, investment, trading, or legal advice, nor does it constitute an offer or solicitation to buy or sell any digital assets. Gate makes no express or implied representations or warranties regarding the accuracy, completeness, or timeliness of the information contained herein. Product features, interfaces, rules, and fee structures may be updated or adjusted at any time. Please refer to the latest announcements and the actual information displayed on the Gate platform for the most accurate details.
Digital asset investments involve significant risk, and prices may fluctuate substantially. You may lose the entire amount of your investment. Please make decisions cautiously based on your own financial situation and risk tolerance after fully understanding the associated risks. If necessary, you are advised to consult an independent professional financial or legal advisor.
For more information about potential risks, please refer to Gate's Risk Disclosure and User Agreement.
