Bitcoin price analysis
Bulls have dominated this week as most assets posted gains over the seven days. Bitcoin (BTC) has seen bull activity this week, recording a weekly increase of 10.7% as the price is $43.6K. Bitcoin has a market cap of $854B, and the trading volume stood at $14.6B as of press time.
Volatility on Bitcoin price for the week has been rising as the Bollinger Bands diverge. BTC’s relative strength indicator is above its average line in the overbought region, indicating bull dominance on Bitcoin price over the week.
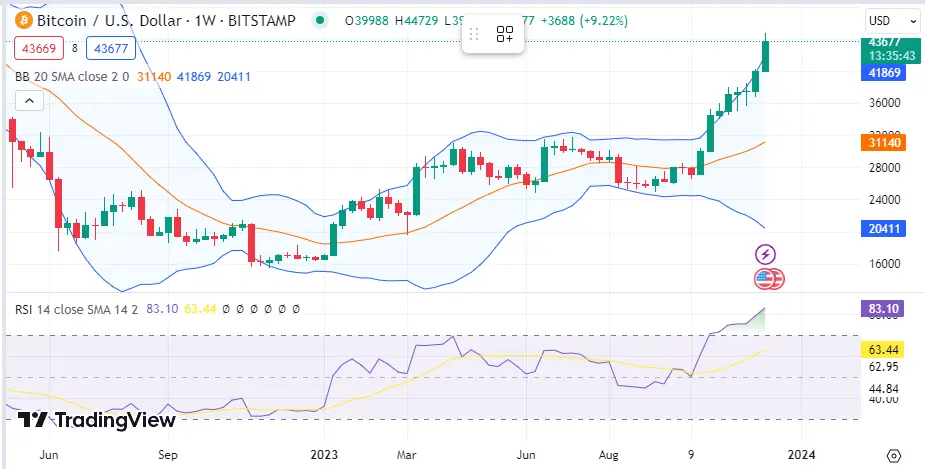 BTC 1-day chart | Source: TradingView## Helium price analysis
Helium (HNT) has seen bull activity this week, recording a weekly increase of 70% as the price is $$4.86. Helium has a market cap of $699M, and the trading volume stood at $10.1B as of press time.
Volatility on Helium price for the week has been rising as the Bollinger Bands diverge. HNT’s relative strength indicator is above its average line in the overbought region, indicating bull dominance on Helium price over the week.
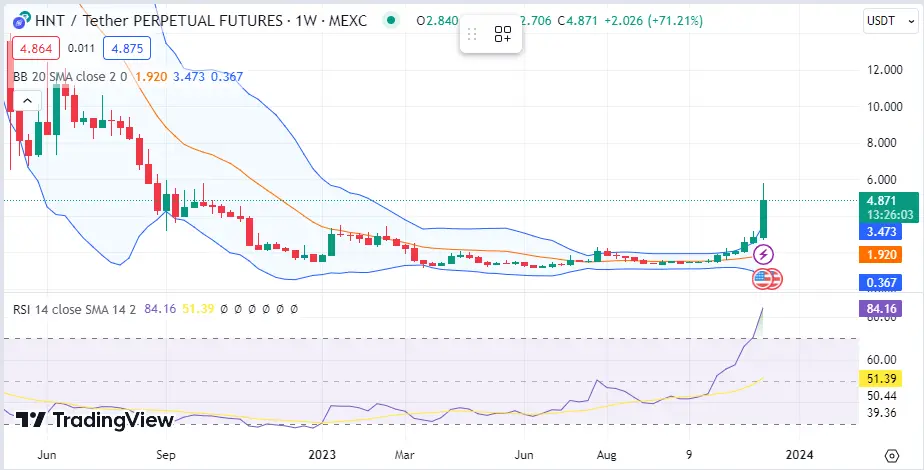 HNT 1-day chart | Source: TradingView## ORDI price analysis
ORDI (ORDI) has seen bull activity this week, recording a weekly increase of 53% as the price is $49.5. ORDI has a market cap of $881M, and the trading volume stood at $881M as of press time.
Volatility on ORDI price for the week has been rising as the Bollinger Bands diverge. ORDI’s relative strength indicator is above its average line in the overbought region, indicating bull dominance on ORDI price over the week.
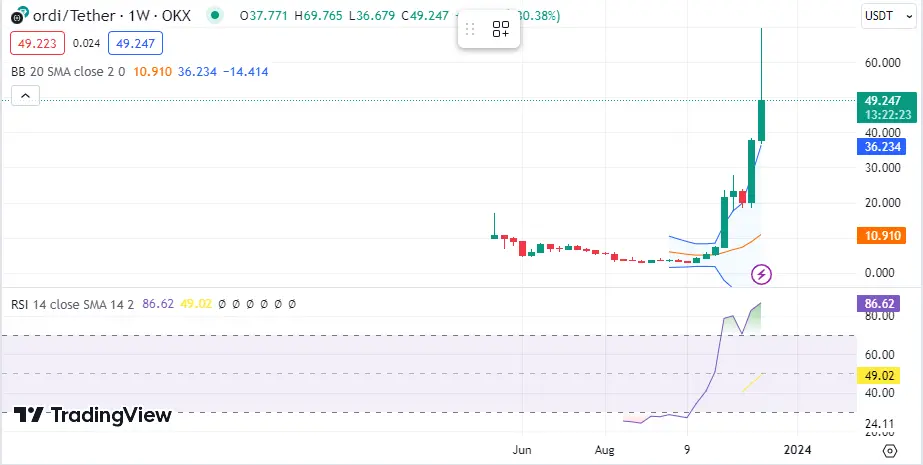 ORDI 1-day chart | Source: TradingView## Avalanche price analysis
Avalanche (AVAX) has seen bull activity this week, recording a weekly increase of 45% as the price is $32.08. Avalanche has a market cap of $1.3M, and the trading volume stood at $1.3B as of press time.
Volatility on Avalanche price for the week has been rising as the Bollinger Bands diverge. AVAX’s relative strength indicator is above its average line in the overbought region, indicating bull dominance on Avalanche price over the week.
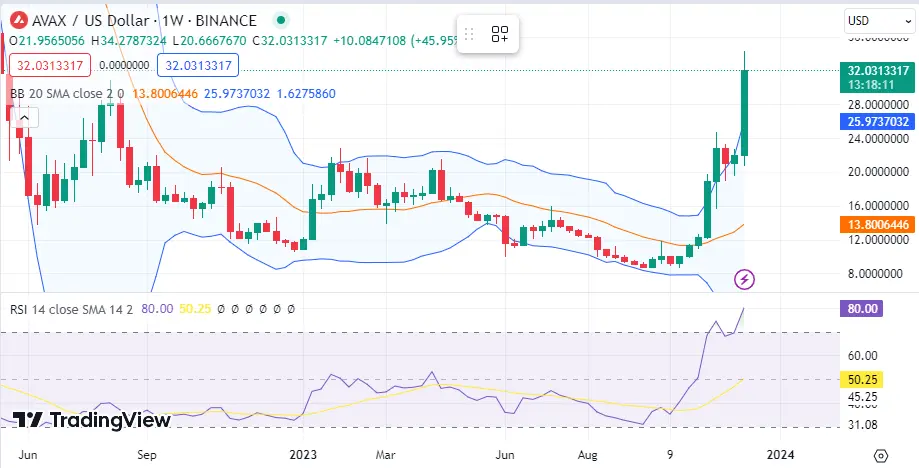 AVAX 1-day chart | Source: TradingView## Beam price analysis
Beam (BEAM) has seen bull activity this week, recording a weekly increase of 45% as the price is $0.01663. Helium has a market cap of $772M, and the trading volume stood at $113M as of press time.
Volatility on Beam price for the week has been rising as the Bollinger Bands diverge. BEAM’s relative strength indicator is above its average line, indicating bull dominance on Beam price over the week.
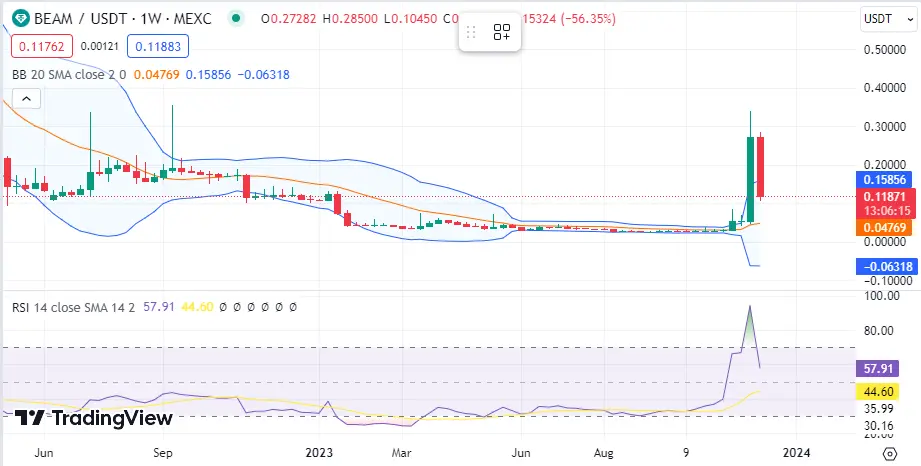 BEAM 1-day chart | Source: TradingView
Aviso: As informações nesta página podem ser provenientes de terceiros e não representam as opiniões ou pontos de vista da Gate. O conteúdo exibido nesta página é apenas para referência e não constitui aconselhamento financeiro, de investimento ou jurídico. A Gate não garante a exatidão ou integridade das informações e não será responsável por quaisquer perdas decorrentes do uso dessas informações. Os investimentos em ativos virtuais apresentam altos riscos e estão sujeitos a uma volatilidade de preços significativa. Você pode perder todo o capital investido. Por favor, compreenda completamente os riscos envolvidos e tome decisões prudentes com base em sua própria situação financeira e tolerância ao risco. Para mais detalhes, consulte o
Aviso Legal.

