SOL تتصاعد — الزخم يتزايد!
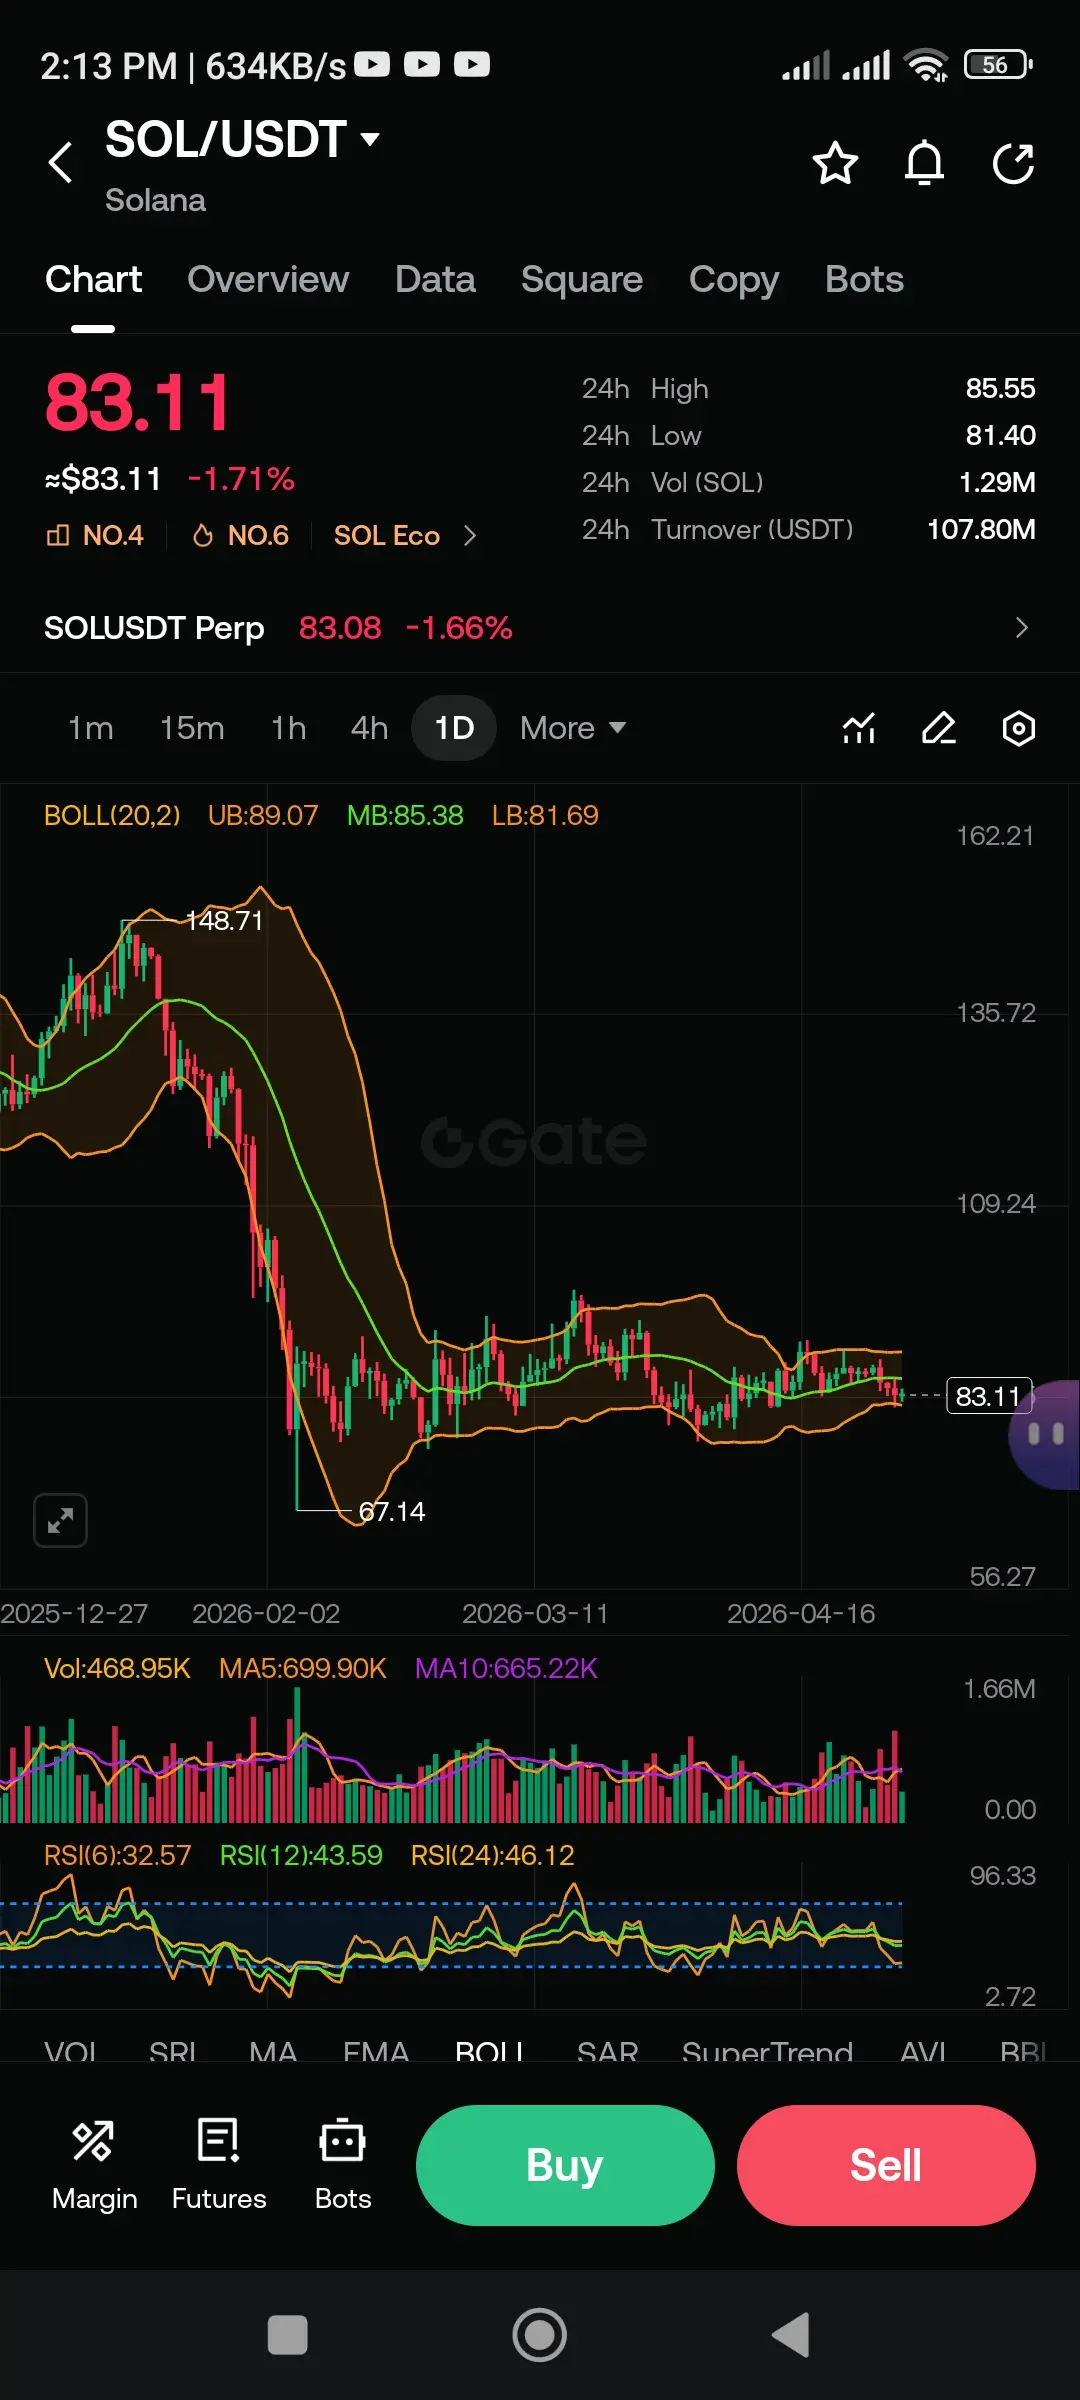
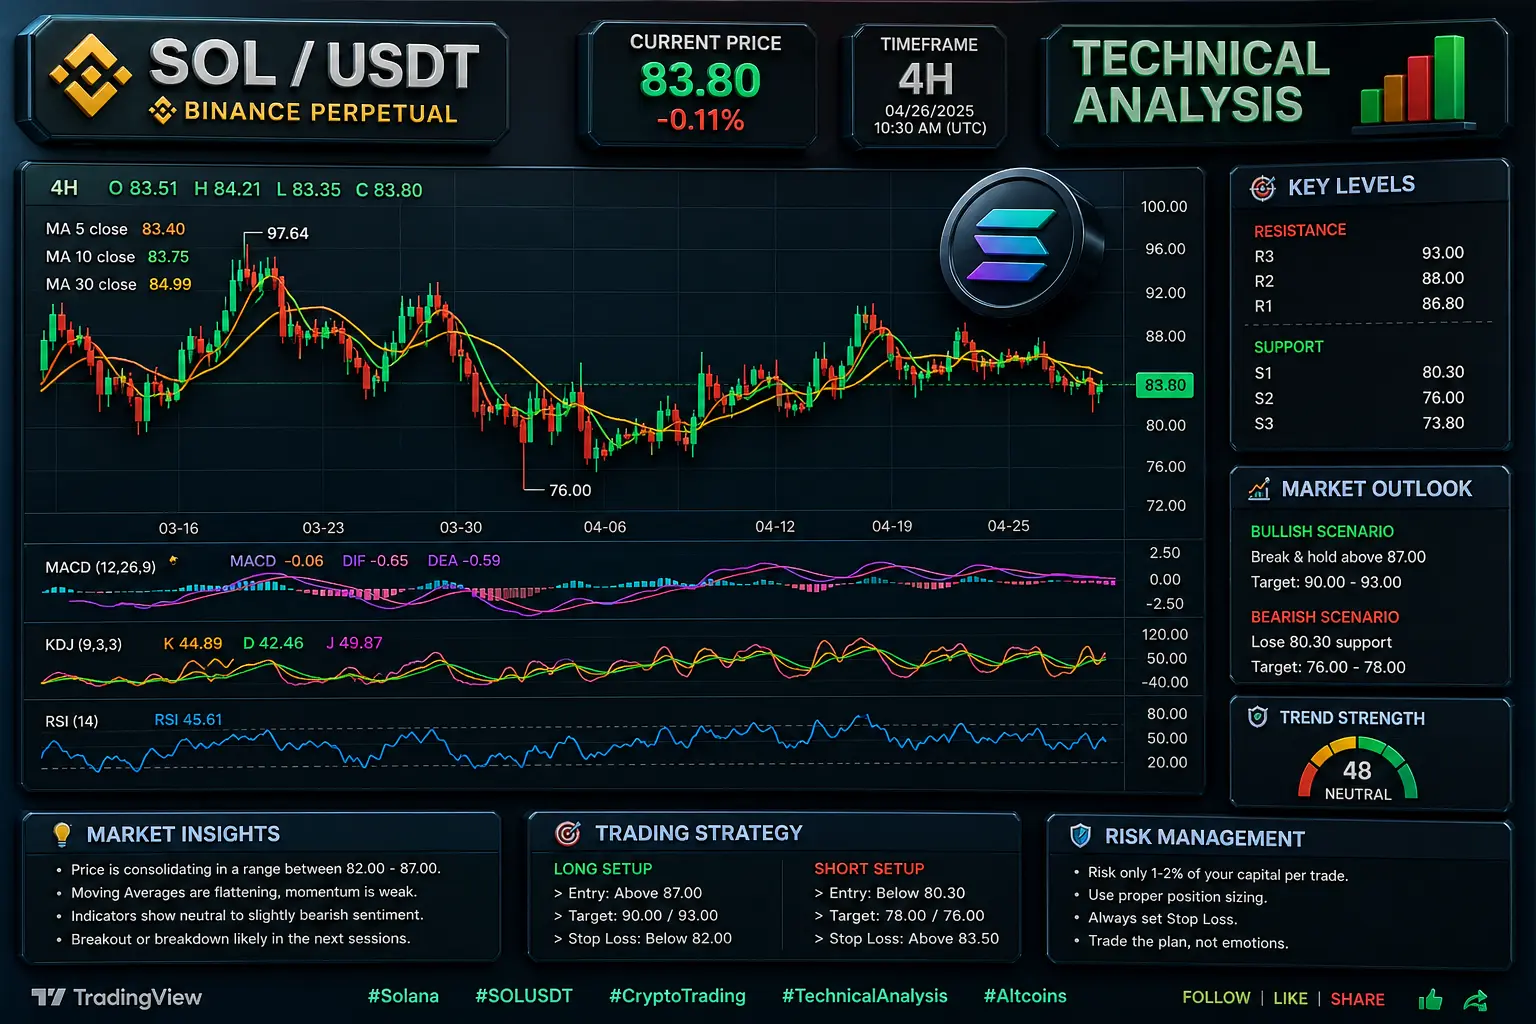
على مخطط 4 ساعات لـ Solana (SOL/USDT)، نرى اختراق صعودي واضح بعد فترة من التوحيد.
📊 ما يحدث:
ارتد السعر بقوة من دعم ~78 ودفع نحو مقاومة 87
شمعة صعودية كبيرة تؤكد ضغط شراء قوي
السعر يتداول الآن فوق المتوسطات MA5، MA10، و MA30 → الاتجاه قصير المدى = صاعد
مؤشر MACD يتحول إلى إيجابي → الزخم يتجه للأعلى
مؤشر RSI يرتفع (ليس في منطقة التشبع الشرائي بعد) → مجال للاستمرار
🔍 المستويات الرئيسية:
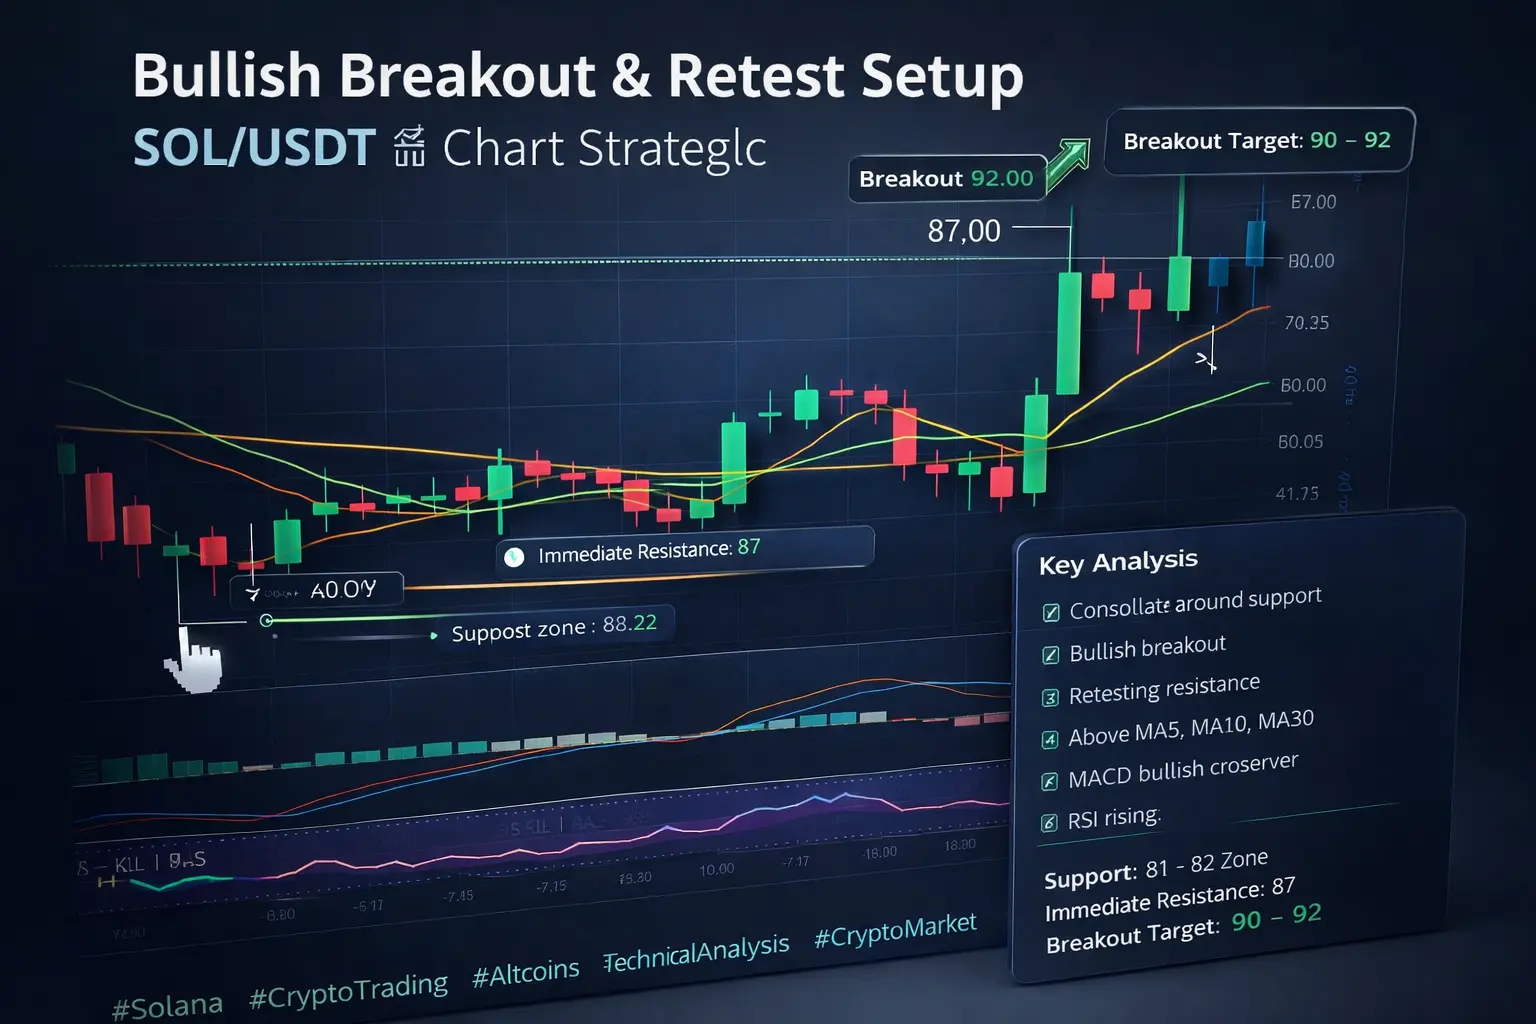
الدعم: منطقة 81 – 82
المقاومة الفورية: 87
هدف الاختراق: 90 – 92 (إذا استمر الحجم)
⚡ رأيي:
يبدو أن هذا إعداد اختراق وإعادة اختبار كلاسيكي.
إذا حافظ SOL على مستوى فوق 82، يظل الثيران مسيطرين.
اختراق نظيف فوق 87 قد يطلق الموجة التالية للأعلى.
⚠️ راقب الاحتيالات — إذا انخفض السعر دون 81، يضعف الزخم.
---
🔥 الخلاصة:
الاتجاه حاليًا صاعد. الزخم والبنية يدعمان الاستمرار للأعلى — لكن التأكيد فوق المقاومة هو المفتاح.
---
#Solana #CryptoTrading #Altcoins #TechnicalAnalysis #CryptoMarket
على مخطط 4 ساعات لـ Solana (SOL/USDT)، نرى اختراق صعودي واضح بعد فترة من التوحيد.
📊 ما يحدث:
ارتد السعر بقوة من دعم ~78 ودفع نحو مقاومة 87
شمعة صعودية كبيرة تؤكد ضغط شراء قوي
السعر يتداول الآن فوق المتوسطات MA5، MA10، و MA30 → الاتجاه قصير المدى = صاعد
مؤشر MACD يتحول إلى إيجابي → الزخم يتجه للأعلى
مؤشر RSI يرتفع (ليس في منطقة التشبع الشرائي بعد) → مجال للاستمرار
🔍 المستويات الرئيسية:
الدعم: منطقة 81 – 82
المقاومة الفورية: 87
هدف الاختراق: 90 – 92 (إذا استمر الحجم)
⚡ رأيي:
يبدو أن هذا إعداد اختراق وإعادة اختبار كلاسيكي.
إذا حافظ SOL على مستوى فوق 82، يظل الثيران مسيطرين.
اختراق نظيف فوق 87 قد يطلق الموجة التالية للأعلى.
⚠️ راقب الاحتيالات — إذا انخفض السعر دون 81، يضعف الزخم.
---
🔥 الخلاصة:
الاتجاه حاليًا صاعد. الزخم والبنية يدعمان الاستمرار للأعلى — لكن التأكيد فوق المقاومة هو المفتاح.
---
#Solana #CryptoTrading #Altcoins #TechnicalAnalysis #CryptoMarket