Key Takeaways
-
Algorand (ALGO) is consolidating after a 13% decline over the past 60 days, while showing stabilization in the last month.
-
The daily chart reveals a repeating bullish fractal, similar to the setup that triggered ALGO’s 300% rally in November 2024.
-
Price is holding inside a long-term accumulation zone between $0.11 and $0.1530.
-
The 200-day moving average near $0.1912 is acting as key resistance and breakout confirmation level.
-
A successful reclaim of the 200 MA could open the path toward $0.60 and the ascending resistance trendline, while a drop below $0.11 would invalidate the bullish setup.
ALGO, the native token of Algorand’s Layer-1 blockchain, has shown steady but muted momentum over the past 30 days, helping slow down its broader correction. Despite this stabilization, ALGO remains down more than 13% over the last 60 days, keeping sentiment cautious across the market.
That said, when looking beyond short-term price noise, the daily chart is beginning to tell a familiar story. The current structure closely resembles a bullish fractal that, in the past, preceded a powerful breakout rally—raising an important question for traders: is this just consolidation, or a quiet accumulation phase before the next move?
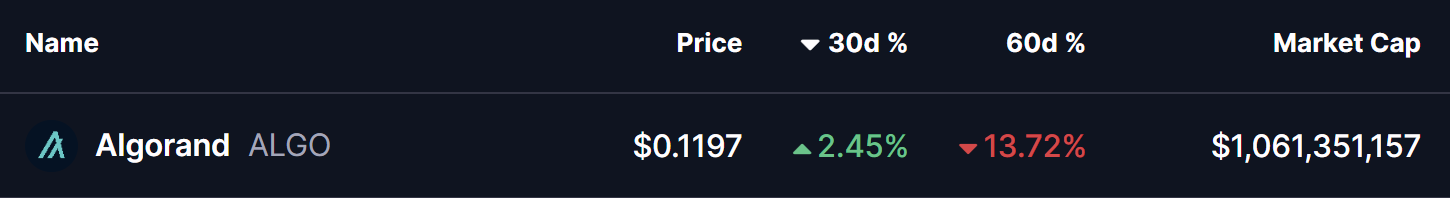
Source: Coinmarketcap
Fractal Setup Hints at a Bullish Reversal
On the daily timeframe, ALGO is displaying early signs of a repeating bullish structure, built around three key technical elements:
-
A rejection from the long-term ascending resistance trendline
-
A prolonged accumulation zone at major historical support
-
A potential reclaim of the 200-day moving average
The current corrective phase began in December 2024, when ALGO was rejected near the ascending resistance trendline around $0.60. That rejection triggered a deep pullback of more than 80%, eventually driving price back into the long-term demand zone between $0.11 and $0.1530—a region that has repeatedly acted as an accumulation area on the chart.
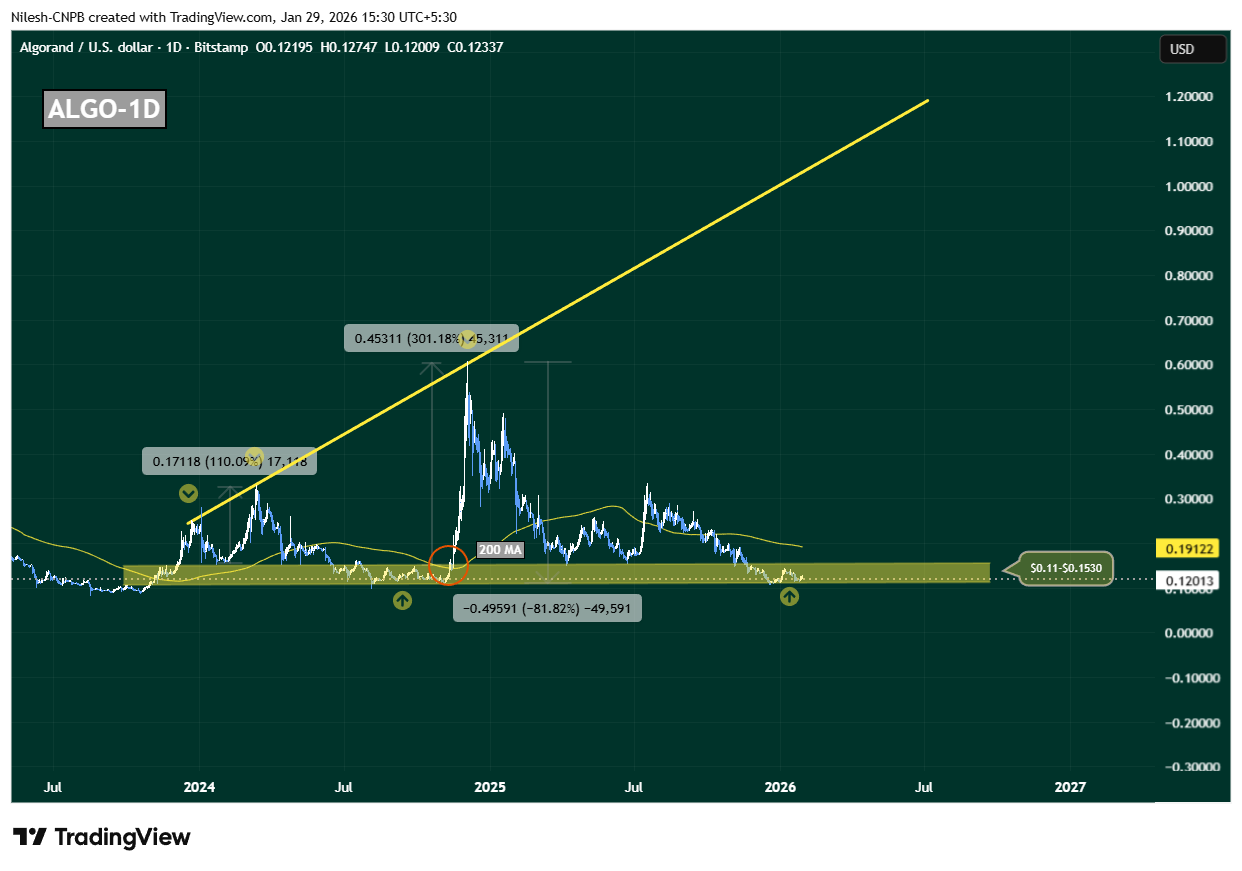
Algorand (ALGO) Daily Chart/Coinsprobe (Source: Tradingview)
This zone is not just technically important; it has also served as a launchpad during previous cycles, where downside momentum stalled and long-term buyers quietly stepped in.
History Rhymes on the ALGO Chart
What makes this setup particularly compelling is how closely it mirrors November 2024’s breakout structure. Back then, ALGO spent extended time consolidating near the same support band before reclaiming the 200-day moving average. Once that level flipped into support, price accelerated sharply—resulting in a 300% rally toward the ascending resistance trendline.
Today, ALGO is once again compressing inside this accumulation range, while the 200-day moving average sits overhead near $0.1912, acting as dynamic resistance. This alignment suggests the market may be approaching another inflection point.
What’s Next for ALGO?
At present, ALGO is hovering near $0.12, firmly inside its long-term accumulation zone. As long as price holds above this region, the broader bullish fractal remains intact.
A clean and sustained reclaim of the 200-day moving average around $0.1912 would be a critical confirmation signal. If bulls manage to flip this level into support, it would closely replicate previous breakout conditions and could trigger a sharp upside expansion. In that scenario, $0.60 becomes a realistic medium-term target, with further upside possible toward the ascending resistance trendline if momentum builds.
However, the structure is not without risk. A decisive breakdown below $0.11 would weaken the accumulation thesis, signal loss of long-term support, and open the door for deeper downside.
For now, ALGO sits at a make-or-break zone. The chart suggests patience is key—but if history repeats, this quiet phase may not last much longer.
Disclaimer: The views and analysis presented in this article are for informational purposes only and reflect the author’s perspective, not financial advice. Technical patterns and indicators discussed are subject to market volatility and may or may not yield the anticipated results. Investors are advised to exercise caution, conduct independent research, and make decisions aligned with their individual risk tolerance.
About Author: Nilesh Hembade is the Founder and Lead Author of Coinsprobe, with over 5 years of experience in the cryptocurrency and blockchain industry. Since launching Coinsprobe in 2023, he has been providing daily, research-driven insights through in-depth market analysis, on-chain data, and technical research.
Disclaimer: The information on this page may come from third parties and does not represent the views or opinions of Gate. The content displayed on this page is for reference only and does not constitute any financial, investment, or legal advice. Gate does not guarantee the accuracy or completeness of the information and shall not be liable for any losses arising from the use of this information. Virtual asset investments carry high risks and are subject to significant price volatility. You may lose all of your invested principal. Please fully understand the relevant risks and make prudent decisions based on your own financial situation and risk tolerance. For details, please refer to
Disclaimer.
Gerelateerde artikelen
Bhutan Sells $18.46M Bitcoin as Price Nears $74k Resistance
The Royal Government of Bhutan transferred approximately 250 BTC worth $18.46 million in the past 24 hours, according to on-chain data from Arkham, continuing a broader pattern of reduced Bitcoin holdings. The transfers included 162 BTC and 69.7 BTC sent to new wallet addresses within a short
CryptoFrontier28m geleden
PEPE Holds Key Range as $0.000005 Breakout Comes Into Focus
Key Insights:
PEPE trades in consolidation with neutral RSI and bearish MACD, signaling a potential buildup before a decisive directional move in coming sessions.
Analysts highlight a $0.000005 breakout level, representing nearly 50% upside if momentum shifts and buying volume strengthens
CryptoNewsLand47m geleden
XRP Consolidation Signals Reset as Bullish Setup Emerges
XRP has recently rebounded to $1.39 after trading between $1.20 and $1.40 due to improved market sentiment. A significant drop in futures open interest reflects reduced speculation, while technical indicators suggest a potential bullish breakout, targeting $1.50 and possibly $1.80.
CryptoNewsLand50m geleden
World Liberty Financial Proposes Restructured Vesting for 62.28B WLFI Tokens With Up to 4.52B Burn
World Liberty Financial proposed a governance restructuring affecting 62.28 billion WLFI tokens, including a potential burn of up to 4.52 billion tokens for eligible holders. The plan aims to align governance participation over two years, amid concerns about token unlocks and governance transparency.
GateNews1u geleden
Solana Adoption Surges to 167M While Usage and Price Diverge
Key Insights
Solana reached 167 million holders, signaling strong adoption growth even as active addresses declined, showing a widening gap between ownership and usage trends.
Institutional interest increased as DeFi Development Corp accumulated over 2.22 million SOL, reinforcing long-term c
CryptoNewsLand1u geleden
XRP Eyes Breakout as US Congress Revisits CLARITY Act
Key Insights:
XRP price faces a decisive week as the US Congress debates the CLARITY Act, with legislative progress likely to influence short-term market direction significantly.
Technical indicators highlight a potential breakout above $1.36, while mixed momentum signals suggest
CryptoNewsLand1u geleden
