
**Date: **Wed, Jan 07, 2026 | 06:20 AM GMT
The broader cryptocurrency market continues to show strong New Year momentum, with Bitcoin (BTC) up around 4% and Ethereum (ETH) gaining over 9% on a weekly basis. This improving sentiment is gradually spilling over into major altcoins — including the DePIN-focused token Akash Network (AKT).
AKT has already posted an impressive 20% weekly gain. While this short-term strength has caught traders’ attention, the more important development is unfolding on the higher-timeframe chart. Recent price action suggests a meaningful shift in market structure, hinting that AKT may be transitioning out of a prolonged corrective phase and into the early stages of a bullish continuation.
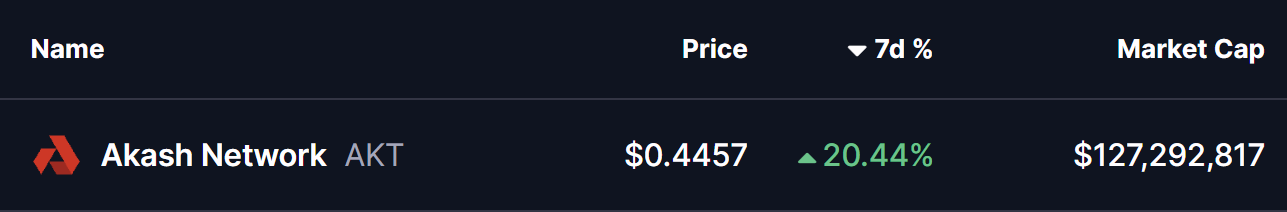
Source: Coinmarketcap
Falling Wedge and Rounding Bottom in Play
On the daily chart, AKT has been trading within a broader falling wedge — a structure that often precedes bullish reversals as selling pressure gradually weakens. Within this larger wedge, price action is also shaping a developing rounding bottom pattern, reflecting steady accumulation and seller exhaustion.
The formation began after AKT faced strong rejection near the $0.5441 resistance zone in late November. That rejection triggered a sharp sell-off, pushing price lower toward the $0.3465 region. However, bears failed to extend losses beyond this area. Instead, demand stepped in, downside momentum slowed, and price began to stabilize.
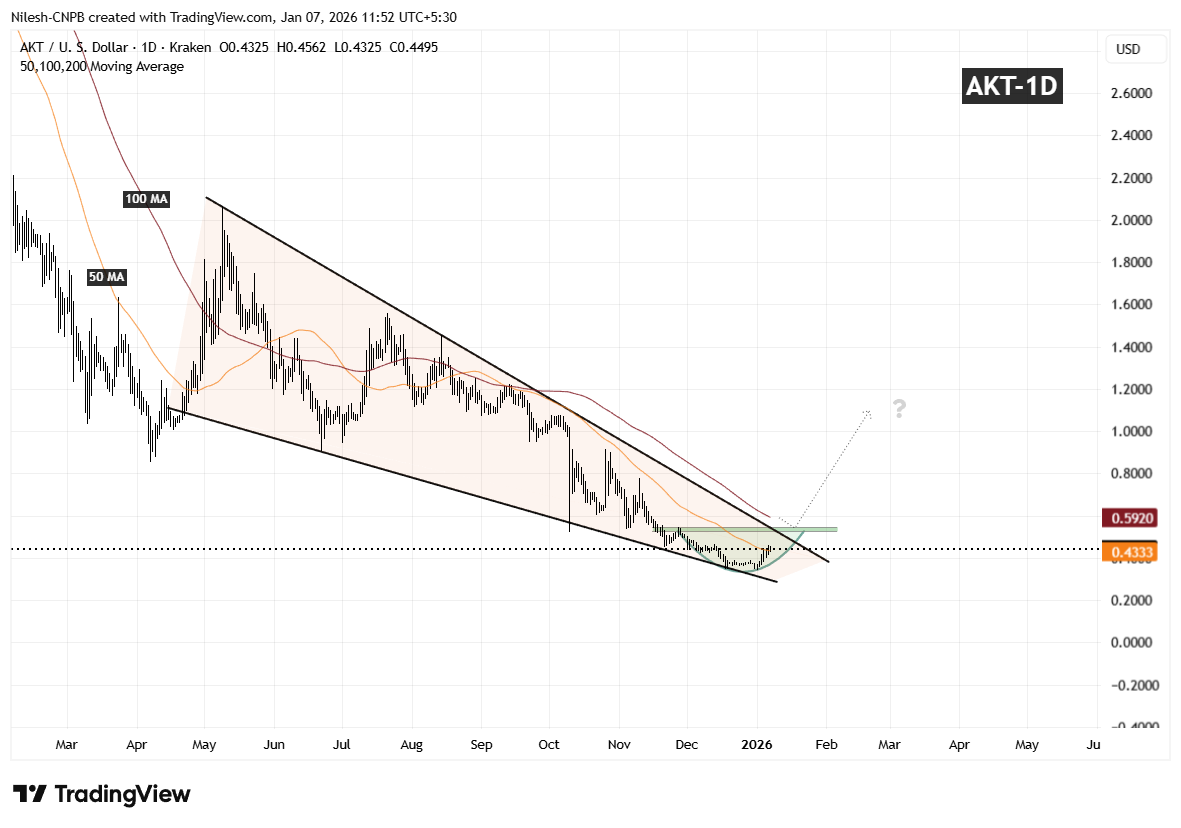
Akash Network (AKT) Daily Chart/Coinsprobe (Source: Tradingview)
Over the following weeks, volatility compressed and AKT started to curl higher in a smooth, rounded fashion — closely matching the textbook behavior of a rounding bottom. Importantly, the recent rebound has pushed price back above the 50-day moving average around $0.4333, a level that had previously acted as resistance and is now beginning to flip into support.
What’s Next for AKT?
If AKT can continue to hold above the 50-day moving average, this area may act as a solid base for further upside attempts. From here, attention shifts toward the descending resistance trendline of the falling wedge, which aligns closely with the $0.5441 resistance zone.
A clean and decisive breakout above this confluence area, followed by sustained acceptance, would confirm a broader bullish expansion phase and mark a clear trend reversal from the prior downtrend. Such a move would likely attract renewed momentum participation as the market recognizes the structural shift.
Until that breakout occurs, the pattern remains in development. Short-term consolidation or shallow pullbacks are still possible as price digests recent gains. However, as long as AKT continues to print higher lows above the established base, the broader technical structure remains constructive.
Overall, the chart suggests AKT is approaching a critical inflection point — one that could determine whether this recovery evolves into a sustained bullish trend as 2026 progresses.
Disclaimer: The views and analysis presented in this article are for informational purposes only and reflect the author’s perspective, not financial advice. Technical patterns and indicators discussed are subject to market volatility and may or may not yield the anticipated results. Investors are advised to exercise caution, conduct independent research, and make decisions aligned with their individual risk tolerance.
About Author: Nilesh Hembade is the Founder and Lead Author of Coinsprobe, with over 5 years of experience in the cryptocurrency and blockchain industry. Since launching Coinsprobe in 2023, he has been providing daily, research-driven insights through in-depth market analysis, on-chain data, and technical research.
Disclaimer: The information on this page may come from third parties and does not represent the views or opinions of Gate. The content displayed on this page is for reference only and does not constitute any financial, investment, or legal advice. Gate does not guarantee the accuracy or completeness of the information and shall not be liable for any losses arising from the use of this information. Virtual asset investments carry high risks and are subject to significant price volatility. You may lose all of your invested principal. Please fully understand the relevant risks and make prudent decisions based on your own financial situation and risk tolerance. For details, please refer to
Disclaimer.
Related Articles
TRUMP Token Whales Hit Five-Month High, Trump Dinner Effect Drives 36% Surge
Trump meme coin TRUMP surged approximately 36% following the announcement of an exclusive dinner event, with whale holdings reaching a five-month high. Large holders are actively increasing positions, but losses are also present in the market, indicating divergent investment behavior. Controversy sparked by political criticism may have limited impact on market performance, but regulatory investigation risks remain a concern to monitor.
MarketWhisper30m ago
Bitcoin Spot ETF Saw $760 Million in Inflows Last Week! But Whether the Rally Continues Requires Monitoring 3 Key Factors
US cryptocurrency spot ETFs showed a significant rebound last week, with Bitcoin and Ethereum recording net inflows of approximately $763.4 million and $160.9 million respectively, with prices bouncing back accordingly. Although the market is showing incremental buying signals, it still faces variables from central bank policies and geopolitical risks in the future. The market will continue to monitor ETF capital inflows and macroeconomic impacts.
CryptoCity44m ago
Market rally continues! Bitcoin returns to $75,000 level, ETF inflows persist
Bitcoin broke through $74,000 on March 16 as institutional capital flowed back into the market, with ETF net inflows reaching $1 billion, shifting market sentiment to bullish. Analysts predict Bitcoin could reach $80,000, but it is currently in a consolidation phase. $75,000 is a key resistance level; a breakout could lead to a test of $90,000, otherwise it risks a pullback.
区块客52m ago
MICA Daily | BTC Stable Above 30-Day Moving Average, Continues to Show Bullish Outlook
According to Binance data, Bitcoin's moving average convergence divergence indicator shows significant improvement in its price trend structure, with current trading price around $73,000, and moving averages in a divergent state, reflecting a market transition phase. Technical analysis indicates that the 30-day moving average is of high importance; if the price maintains above this moving average, it indicates buying support, otherwise it may enter a correction phase. Investors will judge the trend based on changes in moving averages.
区块客55m ago
Bitcoin Surges Toward $75,000: $600 Million Short Liquidations Drive Rally, ETF Inflows Emerge as Key Variable
On March 17, Bitcoin tested the 75,000 US dollar level driven by short liquidations, briefly reaching 75,653 US dollars before retreating. This rally was accompanied by massive liquidations totaling approximately 609 million US dollars in 24 hours, with shorts accounting for a significant proportion. Market sentiment has recovered somewhat, with capital inflows into spot demand and ETF support driving Bitcoin's rally. Future price movements will be influenced by sustained capital inflows and macroeconomic data.
GateNews1h ago
