The price of Cardano (ADA) stabilized around $0.62 today (10) during the Asian afternoon session after breaking through the falling wedge pattern the previous day. This bullish breakout coincides with Bitcoin (BTC) setting a new all-time high, triggering optimistic sentiment in the market for ADA and the entire crypto assets market. Derivative product data shows that the open interest (OI) for ADA is increasing along with bullish bets from traders, reflecting growing investor confidence. Technical prospects indicate that ADA will continue to rise, with a target price of $0.73.
Cardano’s derivatives data shows bullish tendencies
CoinGlass’s Cardano derivatives data shows a bullish market. The open interest for ADA has grown by 13.66% in the past 24 hours, reaching 970.59 million USD. The increase in open interest indicates that new or additional funds are entering the market, with new buying pressure that could drive the current price of ADA up.
The increasingly bullish sentiment for Cardano has triggered a wave of nearly $4.1 million in liquidations over the past 24 hours, with $3.8 million being short positions. As a significant amount of short positions were cleared, the long-short ratio for ADA reached 1.03 on Thursday. This ratio being above 1 reflects the market’s bullish sentiment, as more and more traders are betting that the asset’s price will pump.
ADA Price Analysis: Breakthrough Bullish Reversal Pattern
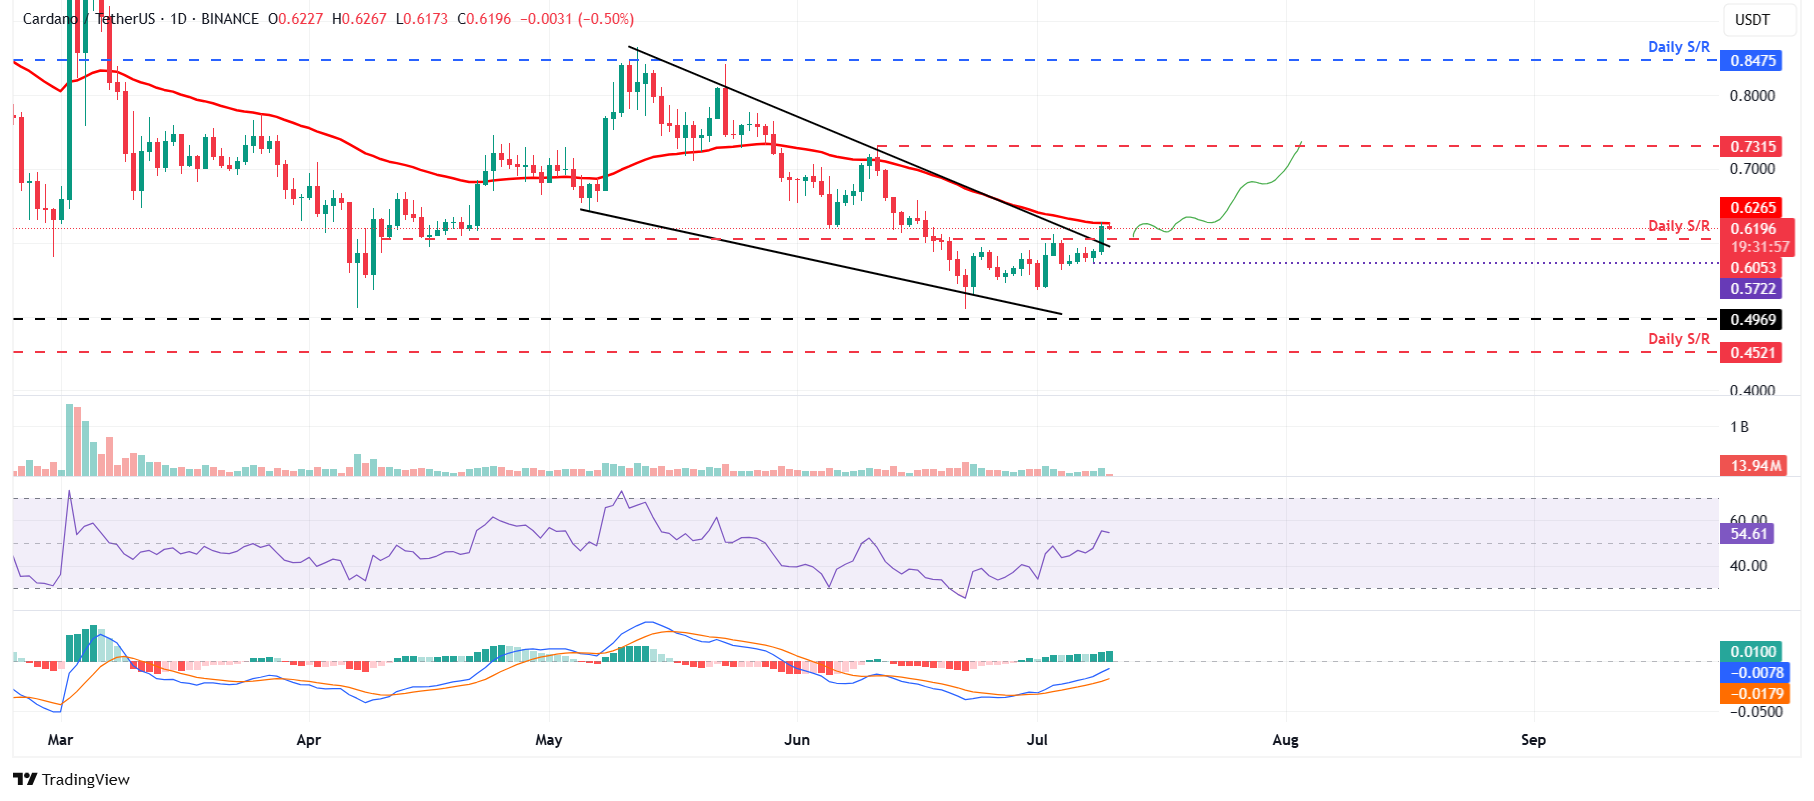
FXStreet analyst Manish Chhetri stated that the ADA price broke through the upper resistance trend line of the falling wedge pattern on Wednesday. This pattern is formed by connecting multiple highs and lows with two trend lines since early May. As of Thursday when this article was written, the coin price has slightly declined after retesting the 50-day Exponential Moving Average (EMA) at $0.62.
If ADA’s daily closing price is above its 50-day EMA of $0.62, it may continue to pump until the high of $0.73 on June 11.
On the daily chart, the Relative Strength Index (RSI) is at 54 and pointing upwards, indicating that bullish momentum is strengthening. Additionally, the Moving Average Convergence Divergence (MACD) indicator showed a bullish crossover on June 29. This indicator also shows green bars rising above the neutral zero line, indicating that bullish momentum is strengthening and the upward trend is continuing.
However, if ADA faces a pullback and closes below the daily support level of $0.60, it may continue to decline to Tuesday’s low of $0.57.
(Source: FXStreet)
Disclaimer: The information on this page may come from third parties and does not represent the views or opinions of Gate. The content displayed on this page is for reference only and does not constitute any financial, investment, or legal advice. Gate does not guarantee the accuracy or completeness of the information and shall not be liable for any losses arising from the use of this information. Virtual asset investments carry high risks and are subject to significant price volatility. You may lose all of your invested principal. Please fully understand the relevant risks and make prudent decisions based on your own financial situation and risk tolerance. For details, please refer to
Disclaimer.
