Bitcoin price analysis
Bulls have dominated this week as most assets posted gains over the seven days. Bitcoin (BTC) has seen bull activity this week, recording a weekly increase of 10.7% as the price is $43.6K. Bitcoin has a market cap of $854B, and the trading volume stood at $14.6B as of press time.
Volatility on Bitcoin price for the week has been rising as the Bollinger Bands diverge. BTC’s relative strength indicator is above its average line in the overbought region, indicating bull dominance on Bitcoin price over the week.
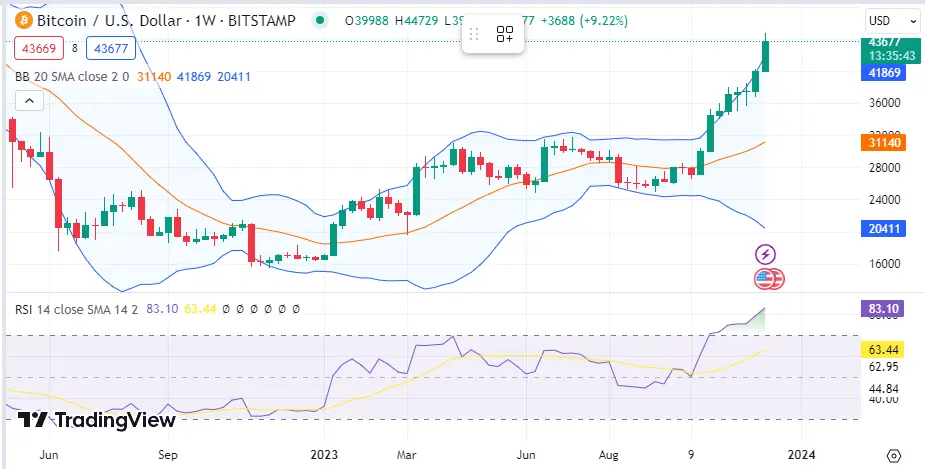 BTC 1-day chart | Source: TradingView## Helium price analysis
Helium (HNT) has seen bull activity this week, recording a weekly increase of 70% as the price is $$4.86. Helium has a market cap of $699M, and the trading volume stood at $10.1B as of press time.
Volatility on Helium price for the week has been rising as the Bollinger Bands diverge. HNT’s relative strength indicator is above its average line in the overbought region, indicating bull dominance on Helium price over the week.
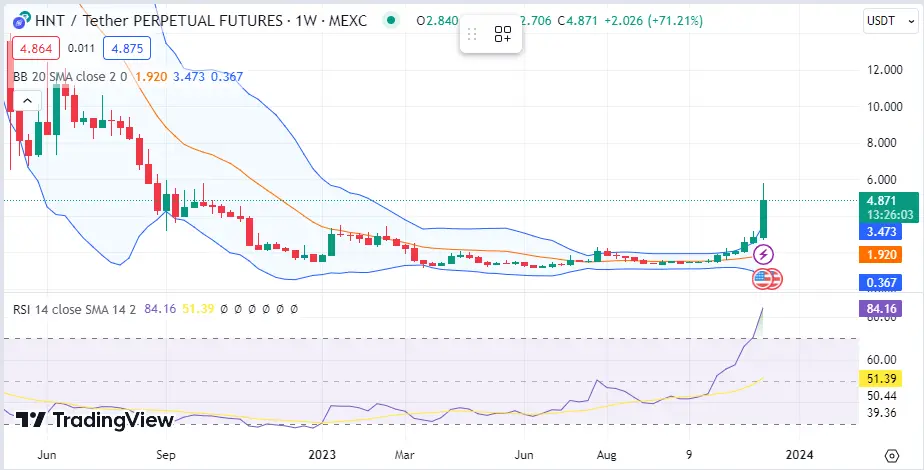 HNT 1-day chart | Source: TradingView## ORDI price analysis
ORDI (ORDI) has seen bull activity this week, recording a weekly increase of 53% as the price is $49.5. ORDI has a market cap of $881M, and the trading volume stood at $881M as of press time.
Volatility on ORDI price for the week has been rising as the Bollinger Bands diverge. ORDI’s relative strength indicator is above its average line in the overbought region, indicating bull dominance on ORDI price over the week.
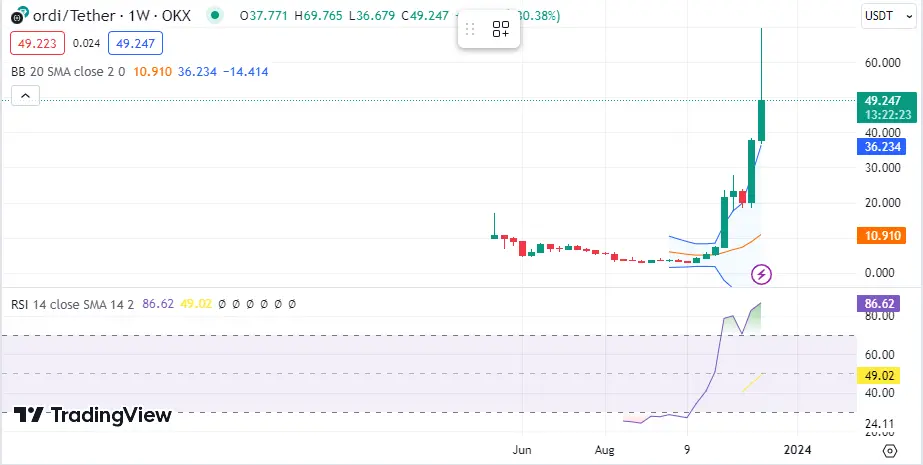 ORDI 1-day chart | Source: TradingView## Avalanche price analysis
Avalanche (AVAX) has seen bull activity this week, recording a weekly increase of 45% as the price is $32.08. Avalanche has a market cap of $1.3M, and the trading volume stood at $1.3B as of press time.
Volatility on Avalanche price for the week has been rising as the Bollinger Bands diverge. AVAX’s relative strength indicator is above its average line in the overbought region, indicating bull dominance on Avalanche price over the week.
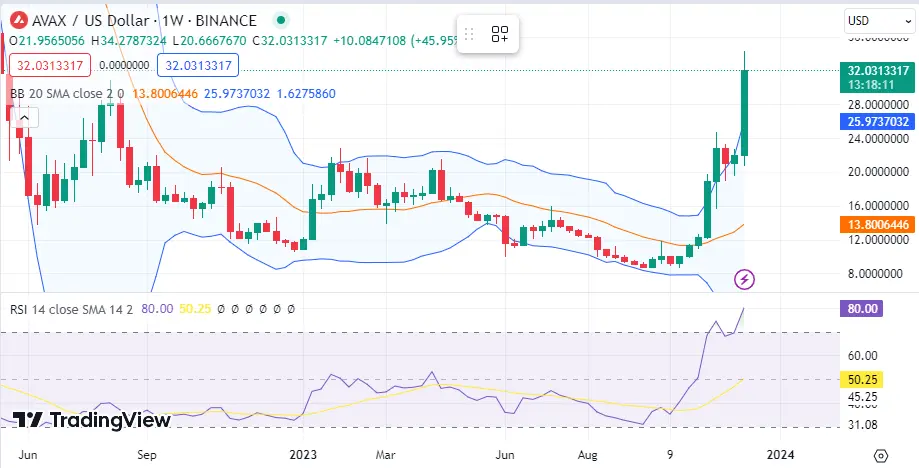 AVAX 1-day chart | Source: TradingView## Beam price analysis
Beam (BEAM) has seen bull activity this week, recording a weekly increase of 45% as the price is $0.01663. Helium has a market cap of $772M, and the trading volume stood at $113M as of press time.
Volatility on Beam price for the week has been rising as the Bollinger Bands diverge. BEAM’s relative strength indicator is above its average line, indicating bull dominance on Beam price over the week.
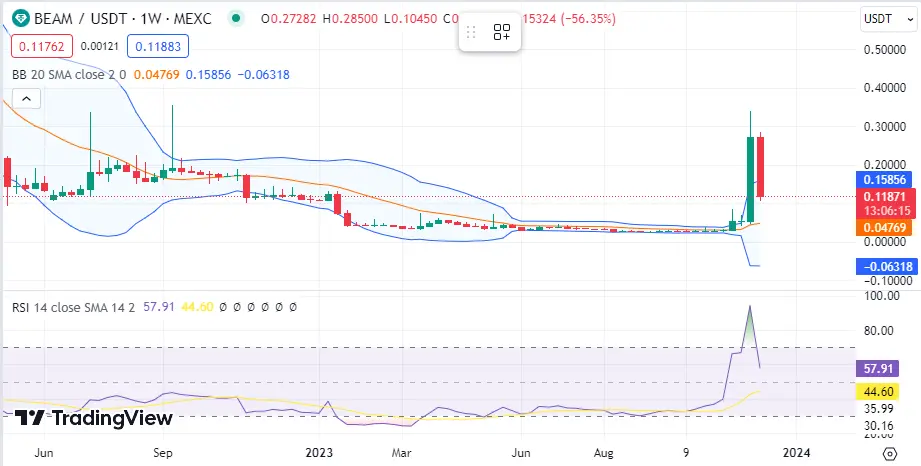 BEAM 1-day chart | Source: TradingView
Avertissement : Les informations contenues dans cette page peuvent provenir de tiers et ne représentent pas les points de vue ou les opinions de Gate. Le contenu de cette page est fourni à titre de référence uniquement et ne constitue pas un conseil financier, d'investissement ou juridique. Gate ne garantit pas l'exactitude ou l'exhaustivité des informations et n'est pas responsable des pertes résultant de l'utilisation de ces informations. Les investissements en actifs virtuels comportent des risques élevés et sont soumis à une forte volatilité des prix. Vous pouvez perdre la totalité du capital investi. Veuillez comprendre pleinement les risques pertinents et prendre des décisions prudentes en fonction de votre propre situation financière et de votre tolérance au risque. Pour plus de détails, veuillez consulter l'
avertissement.