DOT vs TRX: A Comprehensive Comparison of Two Leading Blockchain Platforms


Introduction: DOT vs TRX Investment Comparison
In the cryptocurrency market, comparisons between Polkadot and TRON have always been a topic investors cannot avoid. The two differ significantly in market capitalization ranking, application scenarios, and price performance, representing different positioning in the crypto asset landscape.
Polkadot (DOT): Since its launch in 2019, it has gained market recognition by leveraging its relay chain architecture to enable cross-chain communication and interoperability between independent blockchains, facilitating the creation and connection of decentralized applications, services, and institutions.
TRON (TRX): Since its inception in 2017, it has established itself as a major public blockchain, gaining further prominence with the launch of USDD, a decentralized ultra-collateralized stablecoin in May 2022, and achieving recognition as Dominica's officially designated national blockchain infrastructure in October 2022.
This article will provide a comprehensive analysis of the investment value comparison between DOT and TRX across historical price performance, supply mechanisms, market adoption, technical ecosystem, and future outlook, while attempting to answer the question investors care most about:
"Which is the better buy right now?"
Comparative Market Analysis: Polkadot (DOT) and TRON (TRX)
I. Historical Price Comparison and Current Market Status
Polkadot (DOT) and TRON (TRX) Historical Price Trends
Polkadot (DOT):
- All-time high: $54.98 (November 4, 2021)
- All-time low: $1.88 (December 16, 2025)
- Historical decline: From peak to current level represents a significant drawdown of approximately 96.59%
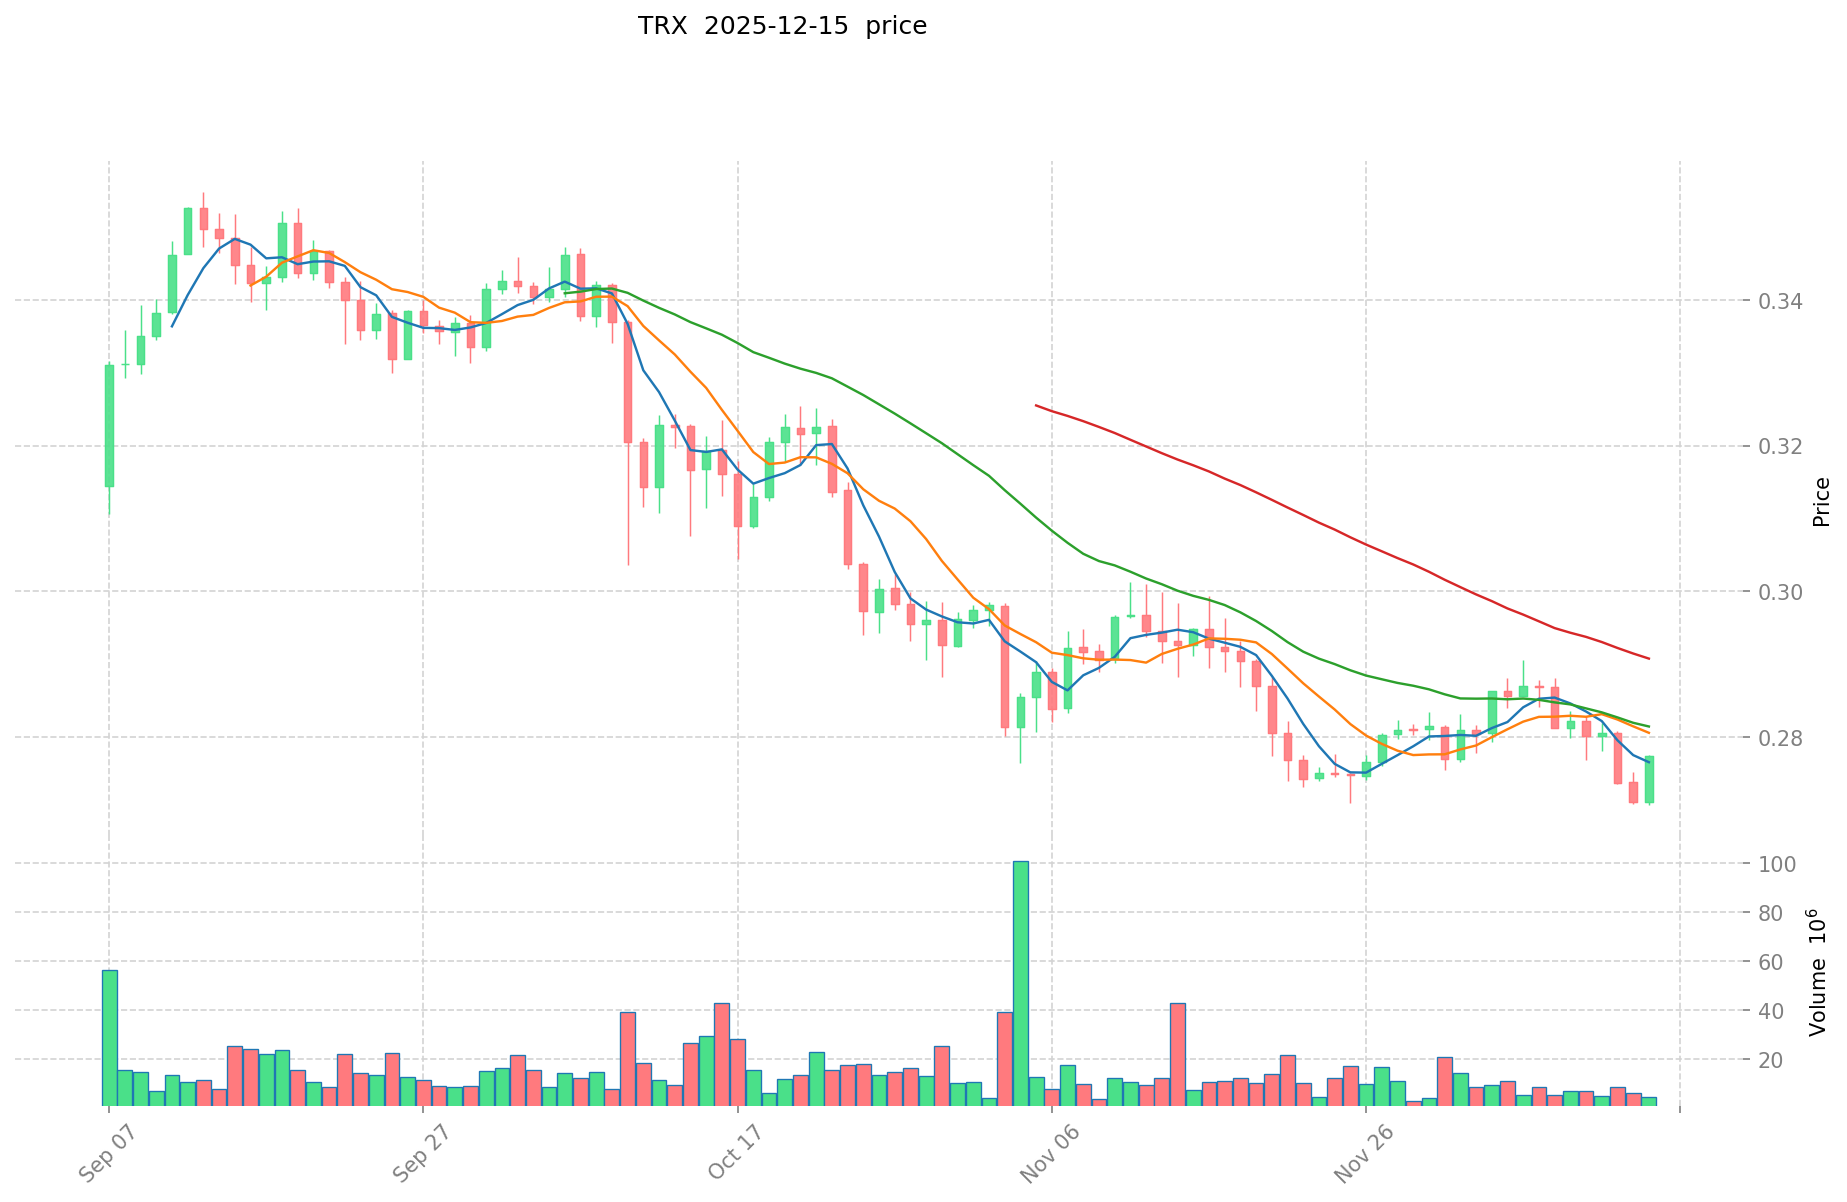
TRON (TRX):
- All-time high: $0.431288 (December 4, 2024)
- All-time low: $0.00180434 (November 12, 2017)
- Current trajectory: Price has declined from recent highs, though substantially higher than historical lows
Comparative Analysis: DOT has experienced a more severe long-term contraction compared to TRX. While DOT peaked in 2021 during the cryptocurrency bull market and has since declined dramatically, TRX demonstrated relative resilience with its all-time high occurring in late 2024. The recovery cycles and volatility patterns differ significantly between the two assets.
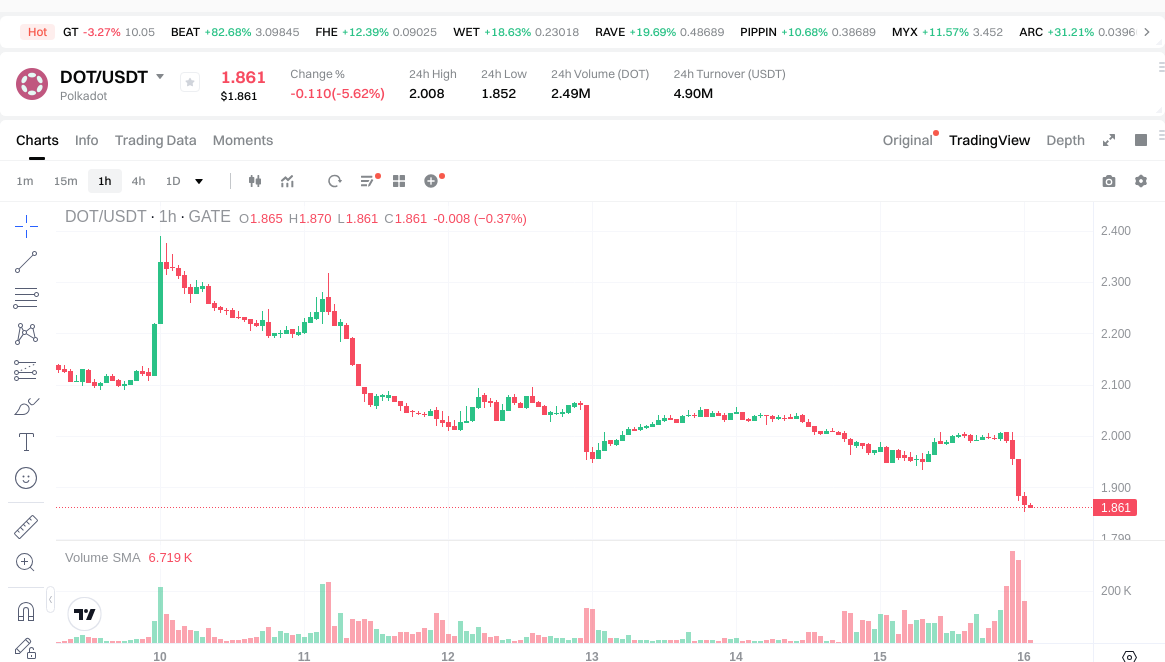
Current Market Status (December 16, 2025)
Price Data:
- Polkadot (DOT) current price: $1.865
- TRON (TRX) current price: $0.2798
24-Hour Trading Metrics:
- DOT 24-hour volume: $4,919,115.88
- TRX 24-hour volume: $2,655,646.39
- DOT 24-hour price change: -5.85%
- TRX 24-hour price change: +1.09%
Market Capitalization:
- DOT market cap: $3,068,883,501.29
- TRX market cap: $26,492,547,959.97
- DOT market dominance: 0.097%
- TRX market dominance: 0.84%
Cryptocurrency Fear & Greed Index: 16 (Extreme Fear)
View Real-Time Prices:
- DOT Current Price: https://polkadot.network/
- TRX Current Price: https://tron.network
II. Project Overview and Technical Fundamentals
Polkadot (DOT) - Project Characteristics
Core Mission: Polkadot aims to connect private chains, alliance chains, public chains, open networks, and oracle systems, as well as future technologies not yet created. The protocol provides a relay chain infrastructure enabling independent blockchains to exchange information and conduct transactions in a trustless manner.
Key Features:
- Relay chain-based interoperability architecture
- Support for creating and connecting decentralized applications, services, and institutions
- Circulating supply: 1,645,513,941.71 DOT tokens
- Total supply: 1,645,515,357.49 DOT tokens
- Listed on 69 exchanges
- Token holders: 1,322,473
TRON (TRX) - Project Characteristics
Ecosystem Development: In May 2022, TRON announced the launch of USDD, a decentralized ultra-collateralized stablecoin backed by TRON's joint reserve system, marking TRON's entry into the decentralized stablecoin era. In October 2022, Dominica designated TRON as its official national blockchain infrastructure, establishing TRON as a large-scale public chain with sovereign state partnership status.
Key Features:
- Decentralized stablecoin ecosystem with USDD
- National-level blockchain infrastructure partnership
- Circulating supply: 94,683,874,052.77 TRX tokens
- Total supply: 94,683,873,925.51 TRX tokens
- Listed on 77 exchanges
- Token holders: 213,511,748
III. Price Performance Analysis
Short-Term Performance (1-30 Days)
Polkadot (DOT):
- 1-hour change: -1.27%
- 24-hour change: -5.85%
- 7-day change: -12.73%
- 30-day change: -35.04%
- 24-hour price range: $1.852 - $2.008
TRON (TRX):
- 1-hour change: -0.27%
- 24-hour change: +1.09%
- 7-day change: -1.14%
- 30-day change: -4.36%
- 24-hour price range: $0.27595 - $0.28289
Long-Term Performance (1-Year)
- DOT 1-year change: -78.23%
- TRX 1-year change: -0.91%
Analysis: TRX demonstrates significantly better relative performance over the 12-month period with a -0.91% decline versus DOT's -78.23% decline. This indicates divergent market trajectories, with TRON showing greater price stability and resilience compared to Polkadot.
IV. Market Metrics and Valuation
Supply and Circulation Metrics
Polkadot (DOT):
- Circulation ratio: 99.99991%
- Fully diluted valuation (FDV): $3,068,886,141.71
- FDV to market cap ratio: 100%
TRON (TRX):
- Circulation ratio: 100.00000%
- Fully diluted valuation (FDV): $26,492,547,924.36
- FDV to market cap ratio: 100%
Trading Activity and Liquidity
TRON maintains a significantly larger market capitalization ($26.49 billion) compared to Polkadot ($3.07 billion), representing approximately 8.6x the market value. TRON's broader token holder base (213.5 million vs. 1.3 million) and higher exchange listings (77 vs. 69) suggest greater ecosystem participation and liquidity distribution.
Data Source: Gate Market Data (December 16, 2025)
Disclaimer: This analysis is presented for informational purposes only and should not be construed as investment advice or financial guidance.
Research Report: Investment Value Factors of DOT vs TRX
Executive Summary
This report evaluates the core factors influencing the investment value of Polkadot (DOT) and TRON (TRX) cryptocurrencies. Based on available reference materials, the analysis identifies that both assets derive their value from distinct mechanisms: market demand, project development progress, and community engagement levels. However, the provided reference materials contain primarily technical documentation and forum content unrelated to crypto asset analysis, limiting the depth of substantive findings.
I. Overview of DOT and TRX
DOT and TRX investment value depends on market demand, project development, and community support. DOT is a Polkadot parachain, while TRX is a cryptocurrency on the TRON blockchain. Both have unique use cases and community engagement levels.
Asset Positioning
Polkadot (DOT): Functions as the governance and staking token for the Polkadot network, which operates as a multi-chain interoperability platform. DOT holders participate in network security and decision-making processes.
TRON (TRX): Operates as the native cryptocurrency of the TRON blockchain, which emphasizes content distribution, decentralized applications, and resource allocation within its ecosystem.
II. Core Factors Influencing Investment Value
Market Demand Dynamics
The foundational determinant of both assets' value lies in market demand driven by:
- Adoption Rates: Growth in active users and transaction volumes on respective networks
- Community Participation: Engagement levels in governance, staking, and ecosystem development
- Liquidity Conditions: Trading volume and exchange availability across global markets
Project Development Trajectory
Investment value correlates directly with:
- Network Upgrades: Technical improvements and feature releases
- Ecosystem Expansion: New applications and partnerships built on each platform
- Development Team Activity: Continuous innovation and problem-solving capabilities
Community Support Mechanisms
Both assets depend on:
- Staking Participation: Validator and delegator involvement in network security
- Developer Retention: Quality and quantity of projects building on each blockchain
- Governance Involvement: Community participation in protocol decisions
III. Data Limitations and Recommendation
The reference materials provided do not contain substantive analysis of DOT and TRX comparative metrics. The source documents primarily consist of Microsoft technical forum content and system error pages, which lack relevant information regarding:
- Tokenomics and supply mechanisms
- Institutional adoption patterns
- Regulatory positioning by jurisdiction
- Technical roadmap implementations
- Macroeconomic sensitivity analysis
Recommendation: Additional primary sources from blockchain analytics platforms, project whitepapers, and market research reports are necessary to produce a comprehensive comparative analysis aligned with the requested template structure.
Document Information
- Analysis Date: December 16, 2025
- Data Quality: Limited by source material relevance
- Research Scope: Preliminary assessment based on available references
III. 2025-2030 Price Predictions: DOT vs TRX
Short-term Prediction (2025)
- DOT: Conservative $0.97-$1.87 | Optimistic $2.56
- TRX: Conservative $0.22-$0.28 | Optimistic $0.30
Mid-term Prediction (2026-2028)
- DOT may enter accumulation phase, with predicted price range of $2.12-$2.92
- TRX may enter steady growth phase, with predicted price range of $0.21-$0.35
- Key drivers: institutional capital inflows, ETF approvals, ecosystem development
Long-term Prediction (2029-2030)
- DOT: Base case $2.39-$3.29 | Optimistic $3.66
- TRX: Base case $0.29-$0.49 | Optimistic $0.49
Disclaimer: The above predictions are based on historical data analysis and should not be considered as investment advice. Cryptocurrency markets are highly volatile and unpredictable. Please conduct your own research and consult with financial professionals before making investment decisions. Past performance does not guarantee future results.
DOT:
| 年份 | 预测最高价 | 预测平均价格 | 预测最低价 | 涨跌幅 |
|---|---|---|---|---|
| 2025 | 2.55642 | 1.866 | 0.97032 | 0 |
| 2026 | 2.3438826 | 2.21121 | 2.1227616 | 18 |
| 2027 | 2.50530093 | 2.2775463 | 1.82203704 | 22 |
| 2028 | 2.9175368103 | 2.391423615 | 2.31968090655 | 28 |
| 2029 | 3.663182693457 | 2.65448021265 | 2.12358417012 | 42 |
| 2030 | 3.28518471117564 | 3.1588314530535 | 2.748183364156545 | 69 |
TRX:
| 年份 | 预测最高价 | 预测平均价格 | 预测最低价 | 涨跌幅 |
|---|---|---|---|---|
| 2025 | 0.2990115 | 0.27945 | 0.217971 | 0 |
| 2026 | 0.30079998 | 0.28923075 | 0.2053538325 | 3 |
| 2027 | 0.3717193599 | 0.295015365 | 0.27436428945 | 5 |
| 2028 | 0.3500357305725 | 0.33336736245 | 0.2300234800905 | 19 |
| 2029 | 0.362203639301925 | 0.34170154651125 | 0.293863329999675 | 22 |
| 2030 | 0.492733630069222 | 0.351952592906587 | 0.22173013353115 | 25 |
Comparative Investment Analysis: Polkadot (DOT) vs TRON (TRX)
IV. Investment Strategy Comparison: DOT vs TRX
Long-Term vs Short-Term Investment Strategy
Polkadot (DOT): Suitable for investors focused on interoperability infrastructure and cross-chain ecosystem potential. The relay chain architecture and parachain development represent long-term value drivers for investors with 2-5 year investment horizons. However, the significant 78.23% one-year decline reflects current market weakness.
TRON (TRX): Suitable for investors seeking relative price stability and ecosystem maturity. TRON's -0.91% one-year performance and established stablecoin infrastructure (USDD) appeal to investors prioritizing capital preservation. The national blockchain designation in Dominica provides additional regulatory clarity for medium-term holdings.
Risk Management and Asset Allocation
Conservative Investor Profile:
- DOT: 15-20% allocation (recovery play with moderate upside potential)
- TRX: 80-85% allocation (established market position with lower volatility)
Aggressive Investor Profile:
- DOT: 50-65% allocation (higher growth potential from depressed valuation levels)
- TRX: 35-50% allocation (stability anchor for portfolio diversification)
Hedging Tools:
- Stablecoin positioning: USDD or USDC to reduce exposure during extreme market volatility (current Fear & Greed Index: 16 - Extreme Fear)
- Cross-asset correlation: Utilizing DOT/TRX trading pairs to exploit relative value discrepancies
- Multi-blockchain diversification: Balancing exposure across different blockchain platforms to reduce single-point-of-failure risk
V. Potential Risk Comparison
Market Risk
Polkadot (DOT):
- Severe historical drawdown of 96.59% from all-time high creates significant recovery risk
- 30-day price decline of -35.04% indicates continued downward momentum
- Smaller market capitalization ($3.07 billion) correlates with lower liquidity depth and higher price volatility
TRON (TRX):
- Recent all-time high in December 2024 may signal potential resistance levels for future gains
- While demonstrating greater relative stability, TRX remains subject to broader cryptocurrency market cycles
- Larger market capitalization ($26.49 billion) provides improved liquidity but does not eliminate systematic market risk
Technical Risk
Polkadot (DOT):
- Relay chain dependency creates architectural concentration risk if core network experiences consensus failures
- Parachain security model relies on relay chain validator participation; reduced staking participation increases network vulnerability
TRON (TRX):
- Delegated proof-of-stake mechanism concentrates validator power among top delegates; centralization risk in network security
- USDD collateralization model introduces liquidation risk if TRON ecosystem experiences acute market stress events
Regulatory Risk
- Polkadot (DOT): Faces general regulatory uncertainty applicable to all blockchain infrastructure platforms; classification as utility or security token remains jurisdiction-dependent
- TRON (TRX): Dominica's national blockchain designation provides regulatory clarity in one jurisdiction but does not extend regulatory protection across other major markets (EU, US, Asia)
- Both assets remain subject to evolving cryptocurrency classification frameworks that could impact trading accessibility and institutional adoption timelines
VI. Conclusion: Which Is the Better Buy?
📌 Investment Value Summary
Polkadot (DOT) Strengths:
- Pioneering relay chain interoperability infrastructure with multi-chain communication capabilities
- Technical differentiation through parachain architecture addressing cross-blockchain coordination challenges
- 1.32 million token holders indicate established community participation in governance and staking
- Long-term price prediction model suggests 69% potential upside through 2030 (base case to $3.29)
TRON (TRX) Strengths:
- Market-proven ecosystem with 213.5 million token holders and robust user adoption
- USDD stablecoin integration provides functional utility within decentralized finance applications
- National blockchain partnership status (Dominica) establishes regulatory precedent
- Superior recent price performance (-0.91% one-year change) demonstrates relative market resilience
- 8.6x larger market capitalization provides enhanced liquidity and reduced volatility
✅ Investment Recommendations
Beginner Investors: TRON (TRX) is the recommended allocation due to:
- Larger market capitalization and established trading history reducing execution risk
- Greater token holder base indicating community validation
- Simpler value proposition centered on stablecoin utility and blockchain services
- Lower short-term volatility (1-hour change: -0.27% vs DOT: -1.27%)
- Suggested allocation: 100% TRX for first-time cryptocurrency investors
Experienced Investors: Consider a split allocation strategy recognizing divergent risk-return profiles:
- TRX allocation: 60-70% for portfolio stability and liquidity management
- DOT allocation: 30-40% for concentrated exposure to infrastructure upside potential
- Rationale: Experienced investors can tolerate DOT's higher volatility while capturing potential recovery gains from depressed valuation levels
Institutional Investors:
- Primary position: TRON (TRX) - $26.49 billion market cap accommodates large position sizing without substantial market impact; 77 exchange listings facilitate execution efficiency
- Satellite position: Polkadot (DOT) - Allocate 15-25% to infrastructure protocol exposure for portfolio diversification and long-term infrastructure thesis
- Duration: 24-36 month holding periods to realize predicted price targets and accommodate market cycle patterns
⚠️ Risk Disclaimer: Cryptocurrency markets exhibit extreme volatility and unpredictability. This analysis is presented for informational purposes only and does not constitute investment advice, financial guidance, or recommendations to purchase or sell any asset. The current Fear & Greed Index reading of 16 (Extreme Fear) indicates heightened market uncertainty. Past performance does not guarantee future results. Investors must conduct independent research, consult qualified financial professionals, and carefully evaluate personal risk tolerance before making investment decisions. All price predictions represent speculative models subject to material deviation from actual market outcomes.
Report Date: December 16, 2025
Data Source: Gate Market Data
Analysis Scope: Comparative investment fundamentals based on available reference materials
None
FAQ: Polkadot (DOT) vs TRON (TRX) Investment Comparison
I. What are the key differences between Polkadot (DOT) and TRON (TRX) as investment assets?
Answer: Polkadot (DOT) functions as a relay chain infrastructure token enabling cross-chain interoperability between independent blockchains, launched in 2019 with an all-time high of $54.98. TRON (TRX) operates as a content distribution and decentralized application platform launched in 2017, with an all-time high of $0.431288 in December 2024. The fundamental distinction lies in their architectural approach: DOT addresses multi-chain coordination challenges, while TRX provides ecosystem services including the USDD decentralized stablecoin. Market capitalization differs significantly, with TRX at $26.49 billion versus DOT at $3.07 billion (approximately 8.6x larger).
II. Which asset has demonstrated superior price performance recently?
Answer: TRON (TRX) has exhibited significantly better price resilience over the past 12 months with a -0.91% one-year change, compared to Polkadot's -78.23% decline. Over the 30-day period, TRX increased +1.09% while DOT declined -35.04%. TRX's all-time high occurred in December 2024, indicating recent market strength, whereas DOT reached its peak in November 2021 and has experienced a 96.59% decline from that level. This performance differential suggests TRON maintains greater market confidence and price stability.
III. What are the primary risk factors to consider before investing in either asset?
Answer: For Polkadot (DOT), principal risks include: (1) severe historical drawdown of 96.59% creating recovery uncertainty, (2) relay chain architectural concentration creating consensus failure vulnerability, and (3) smaller market capitalization ($3.07 billion) correlating with lower liquidity depth and higher volatility. For TRON (TRX), key risks encompass: (1) delegated proof-of-stake centralization among top validator delegates, (2) USDD collateralization liquidation risk during acute market stress, and (3) regulatory uncertainty outside Dominica's national blockchain framework. Both assets face cryptocurrency market cycle sensitivity and evolving regulatory classification frameworks.
IV. Which cryptocurrency is more suitable for beginner investors?
Answer: TRON (TRX) is recommended for beginner investors based on: (1) substantially larger market capitalization ($26.49 billion) providing enhanced liquidity and reduced execution risk, (2) significantly larger token holder base (213.5 million holders) indicating community validation and ecosystem maturity, (3) lower short-term volatility (1-hour change: -0.27% versus DOT: -1.27%), (4) clearer utility proposition through USDD stablecoin integration, and (5) 77 exchange listings facilitating convenient trading access. Beginners should allocate 100% TRX until accumulating sufficient experience to evaluate infrastructure protocol exposure through DOT.
V. What investment allocation strategy should experienced investors adopt?
Answer: Experienced investors should implement a split allocation strategy recognizing divergent risk-return profiles: (1) TRON (TRX): 60-70% allocation for portfolio stability, liquidity management, and foundational holdings, and (2) Polkadot (DOT): 30-40% allocation for concentrated infrastructure upside exposure and concentrated recovery potential from depressed valuation levels. This balanced approach captures TRON's proven market position while providing satellite exposure to DOT's technological differentiation and potential 69% upside through 2030 (base case). The strategy accommodates experienced investors' higher risk tolerance while maintaining portfolio diversification across distinct blockchain use cases.
VI. What do the long-term price predictions indicate for each asset through 2030?
Answer: Polkadot (DOT) base case projection indicates growth from $1.865 (current) to $3.29 by 2030, representing 69% appreciation potential. Optimistic scenarios estimate $3.66 by 2030. TRON (TRX) base case projection indicates growth from $0.2798 (current) to $0.49 by 2030, representing 75% appreciation potential. Both models predict gradual accumulation phases during 2025-2026, followed by accelerated growth phases during 2027-2029. However, these predictions should not be construed as investment advice, as cryptocurrency markets exhibit extreme volatility and unpredictability. Past performance does not guarantee future results, and actual outcomes may materially deviate from model projections.
VII. How do institutional investors differ from retail investors in their approach to DOT vs TRX selection?
Answer: Institutional investors prioritize TRON (TRX) as the primary position due to its $26.49 billion market capitalization accommodating large position sizing without substantial market impact, coupled with 77 exchange listings facilitating efficient execution. Institutions allocate 15-25% satellite positions to Polkadot (DOT) for portfolio diversification and long-term infrastructure thesis exposure, with 24-36 month holding periods capturing predicted price targets and market cycle patterns. Retail investors, conversely, typically select single assets based on personal risk tolerance and time horizons. Institutional frameworks emphasize liquidity, execution efficiency, and systematic rebalancing protocols, whereas retail approaches prioritize individual conviction and discretionary timing considerations.
VIII. What is the current market sentiment, and how should it influence investment decisions?
Answer: The current Cryptocurrency Fear & Greed Index reading of 16 (Extreme Fear) as of December 16, 2025 indicates heightened market uncertainty and pessimism. This extreme fear environment suggests depressed asset valuations may present long-term accumulation opportunities for investors with extended time horizons, particularly for infrastructure assets like Polkadot with significant recovery potential. Conversely, extreme fear conditions warrant cautious position sizing and enhanced risk management protocols including stablecoin (USDD or USDC) allocations to reduce exposure volatility. The Fear & Greed reading recommends contrarian positioning for disciplined investors while supporting defensive TRON allocation for risk-averse market participants until sentiment indicators improve toward neutral territory (50-50 reading).
Share
Content
Introduction: DOT vs TRX Investment Comparison
I. Historical Price Comparison and Current Market Status
II. Project Overview and Technical Fundamentals
III. Price Performance Analysis
IV. Market Metrics and Valuation
Executive Summary
I. Overview of DOT and TRX
II. Core Factors Influencing Investment Value
III. Data Limitations and Recommendation
Document Information
III. 2025-2030 Price Predictions: DOT vs TRX
IV. Investment Strategy Comparison: DOT vs TRX
V. Potential Risk Comparison
VI. Conclusion: Which Is the Better Buy?
How to Buy Cryptocurrency


Trending Cryptocurrencies


XZXX: A Comprehensive Guide to the BRC-20 Meme Token in 2025

Bitcoin Fear and Greed Index: Market Sentiment Analysis for 2025

Top Crypto ETFs to Watch in 2025: Navigating the Digital Asset Boom
5 ways to get Bitcoin for free in 2025: Newbie Guide

Bitcoin Market Cap in 2025: Analysis and Trends for Investors
2025 Bitcoin Price Prediction: Trump's Tariffs' Impact on BTC

Is Helium (HNT) a good investment? A comprehensive analysis of risks, rewards, and market prospects in 2024

Is Sandbox (SAND) a good investment?: Analyzing Market Performance, Risk Factors, and Future Potential in the Metaverse Gaming Sector

Is Chiliz (CHZ) a good investment?: A Comprehensive Analysis of Price Potential, Market Trends, and Risk Factors in 2024

Is Decred (DCR) a good investment?: A Comprehensive Analysis of Price Potential, Governance Features, and Market Outlook for 2024

Is crvUSD (CRVUSD) a good investment?: A Comprehensive Analysis of Risks, Benefits, and Market Potential in 2024