
XRP had a boring week. The price dipped around 5 percent and now trades at $1.32. Our team at CaptainAltcoin posted a weekly price prediction for XRP today, and the projections indicate another quiet week ahead.
But the XRP community never stays quiet for long. Someone always has a bold prediction. Javon Marks, a crypto analyst who has been vocal about XRP in recent years, just dropped a chart that got everyone talking.
Marks shared a 2-week XRP/Bitcoin chart on TradingView. The chart tracks how much XRP is worth in Bitcoin terms, not in dollars. This pair, XRP/BTC, tells a different story than the USD price. When XRP/BTC goes up, XRP is gaining strength against Bitcoin. When it goes down, Bitcoin is outperforming.
Marks pointed to a pattern that played out before. The last time XRP broke out against Bitcoin in a similar setup, the pair climbed over 243 percent. Following that breakout, XRP’s dollar price went on to climb over 500 percent, moving from the $0.50 range all the way to $3.30.
Now he says the same thing is happening again, but on a larger scale.
XRP Chart Analysis
The 2-week chart from Marks shows XRP/BTC trading at 0.00002012 at the time of his post. The pair has been consolidating for years, forming a massive descending triangle or a long-term accumulation pattern. The chart lines show a clear breakout above a multi-year resistance level that had held XRP/BTC down since the 2017-2018 peak.
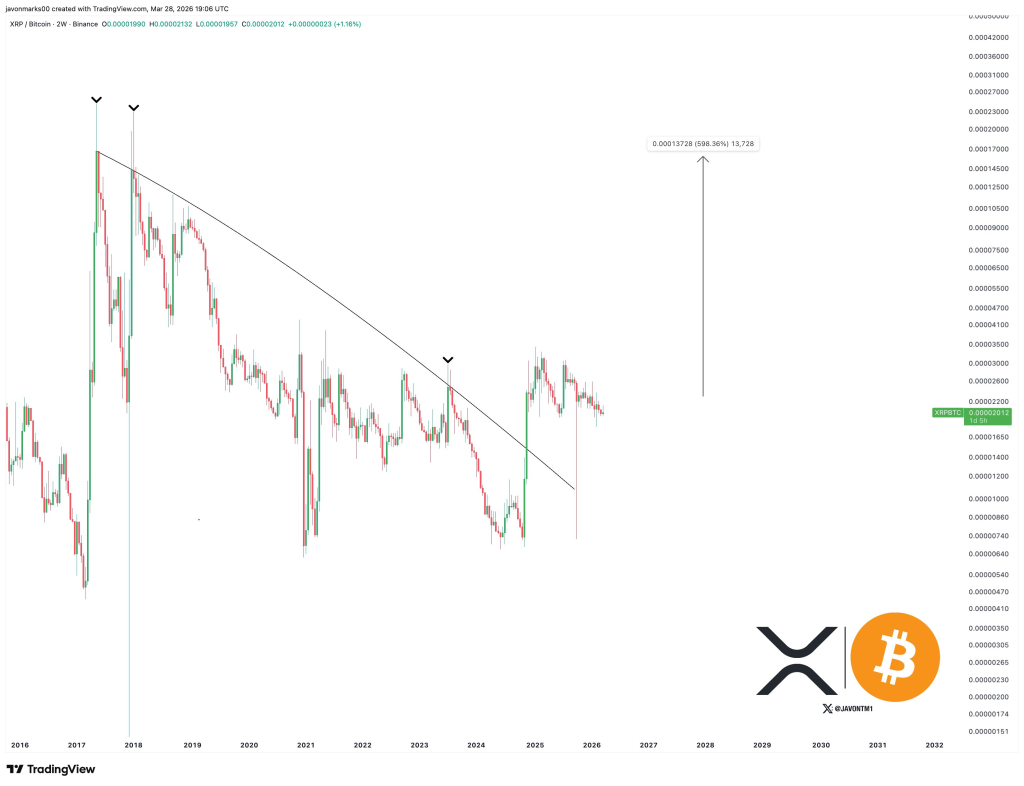
Source: X/@JavonTM1
In the previous cycle, the breakout happened from a smaller structure. That delivered a 243 percent move in the pair and a 500 percent move in XRP’s dollar price.
This time, the breakout structure is much larger. The base is wider. The resistance line goes back several years. Marks projects a 635 percent increase in XRP/BTC from the breakout point.
If that plays out, XRP’s dollar price would hit over $10. That is the calculation. A 635 percent rally in XRP/BTC means XRP gains massive strength against Bitcoin. With Bitcoin sitting in the $60,000 to $70,000 range, a 635 percent jump in the pair sends XRP well into double digits.
Technical analysis on a 2-week chart carries more weight than a 1-hour or 1-day chart. Longer timeframes filter out noise and show true structural breaks. The breakout Marks highlighted is not a small wiggle. It is a clean move above a resistance line that had rejected XRP/BTC multiple times over several years.
That said, patterns repeat until they do not. The last breakout delivered huge gains. This one could too. But the market is different now. Bitcoin dominance remains high. Altcoin seasons have been shorter and weaker than past cycles.
Still, for XRP holders looking for a reason to stay bullish, Marks just handed them one. The weekly price action in dollars looks boring. However, the XRP/BTC chart is worth checking out.
Read also: Claude AI Predicts the Price of XRP and Solana By the End of 2026
Disclaimer: The information on this page may come from third parties and does not represent the views or opinions of Gate. The content displayed on this page is for reference only and does not constitute any financial, investment, or legal advice. Gate does not guarantee the accuracy or completeness of the information and shall not be liable for any losses arising from the use of this information. Virtual asset investments carry high risks and are subject to significant price volatility. You may lose all of your invested principal. Please fully understand the relevant risks and make prudent decisions based on your own financial situation and risk tolerance. For details, please refer to
Disclaimer.
Gerelateerde artikelen
Machi Increases Bitcoin 40x Long to $14.5M, Holds $23.3M Ethereum Position on May 1
According to HyperInsight monitoring, Huang Licheng (Machi) increased his Bitcoin 40x long position to $14.5 million on May 1, with an average entry price of $76,357 and liquidation price of $72,904.5.
Machi also holds a 25x leveraged Ethereum long position valued at $23.3 million, with entry price
GateNews5m geleden
XRP-Bitcoin Correlation at 0.628; XRP Falls 1.55x Harder Than BTC, Says Bill Morgan
According to pro-XRP lawyer Bill Morgan, XRP and Bitcoin show a 90-day correlation of 0.628, indicating strong directional correlation despite different percentage movements. Morgan clarified that correlation does not mean XRP replicates Bitcoin's exact percentage moves, but rather follows its direc
GateNews1u geleden
Benchmark Defends Strategy's STRC Bitcoin Accumulation Model
Benchmark analyst Mark Palmer defended Strategy's STRC preferred stock model against critiques framing it as a "circular" Ponzi scheme structure in a Wednesday report, arguing such characterizations "mischaracterize" how the company raises and deploys capital. According to Palmer's analysis, STRC
CryptoFrontier1u geleden
Bitcoin Breaks April Support Level on FOMC Day
Bitcoin fell below the ascending support line that guided its April rally, according to technical analysis shared by Elja. The breakdown occurred on FOMC day, with BTC trading near $75,633 after losing the lower boundary of its rising channel that had held through April as the price
CryptoFrontier1u geleden
On-Chain User Exits BTC Long at 76061, Facing Losses of 646K–4.485M USD
According to on-chain analyst Ai 姨, the user "先定 10 个大目标" exited BTC long positions with a stop-loss point around 76061 USD, down from an entry price of 77686.5 USD.
Depending on position size, the predicted losses range from approximately 646,000 USD
GateNews1u geleden
U.S. Spot Bitcoin ETFs See $137.75M in Net Outflows on April 29, Extending Three-Day Withdrawal Streak
U.S. spot Bitcoin ETFs recorded $137.75 million in net redemptions on April 29, extending a three-day streak of outflows. The withdrawals mark a shift in short-term institutional positioning following a strong April, which saw more than $2.4 billion in net inflows to Bitcoin funds overall.
GateNews1u geleden