ZK vs VET: Comparing Zero-Knowledge Proofs and Vechain's Enterprise Blockchain Solutions


Introduction: ZK vs VET Investment Comparison
In the cryptocurrency market, the comparison between zkSync and VeChain has become an unavoidable topic for investors. The two assets differ significantly in market capitalization ranking, application scenarios, and price performance, representing distinct positioning within the crypto asset landscape.
zkSync (ZK): Launched in 2018, zkSync has gained market recognition through its positioning as a verifiable blockchain network secured by mathematics, offering Layer-2 scaling solutions for blockchain efficiency.
VeChain (VET): Founded in 2015 by Sunny Lu, VeChain has established itself as an enterprise-grade Layer-1 blockchain, initially recognized for supply chain transparency and anti-counterfeiting solutions, with major partnerships including DNV, Walmart, and Boston Consulting Group.
This article will provide a comprehensive analysis of the investment value comparison between ZK and VET across historical price trends, supply mechanisms, enterprise adoption, and technological ecosystems, while attempting to answer the question that concerns investors most:
"Which is the better buy right now?"
Comparative Analysis Report: ZKsync (ZK) vs VeChain (VET)
I. Price History Comparison and Current Market Status
ZKsync (ZK) and VeChain (VET) Historical Price Trends
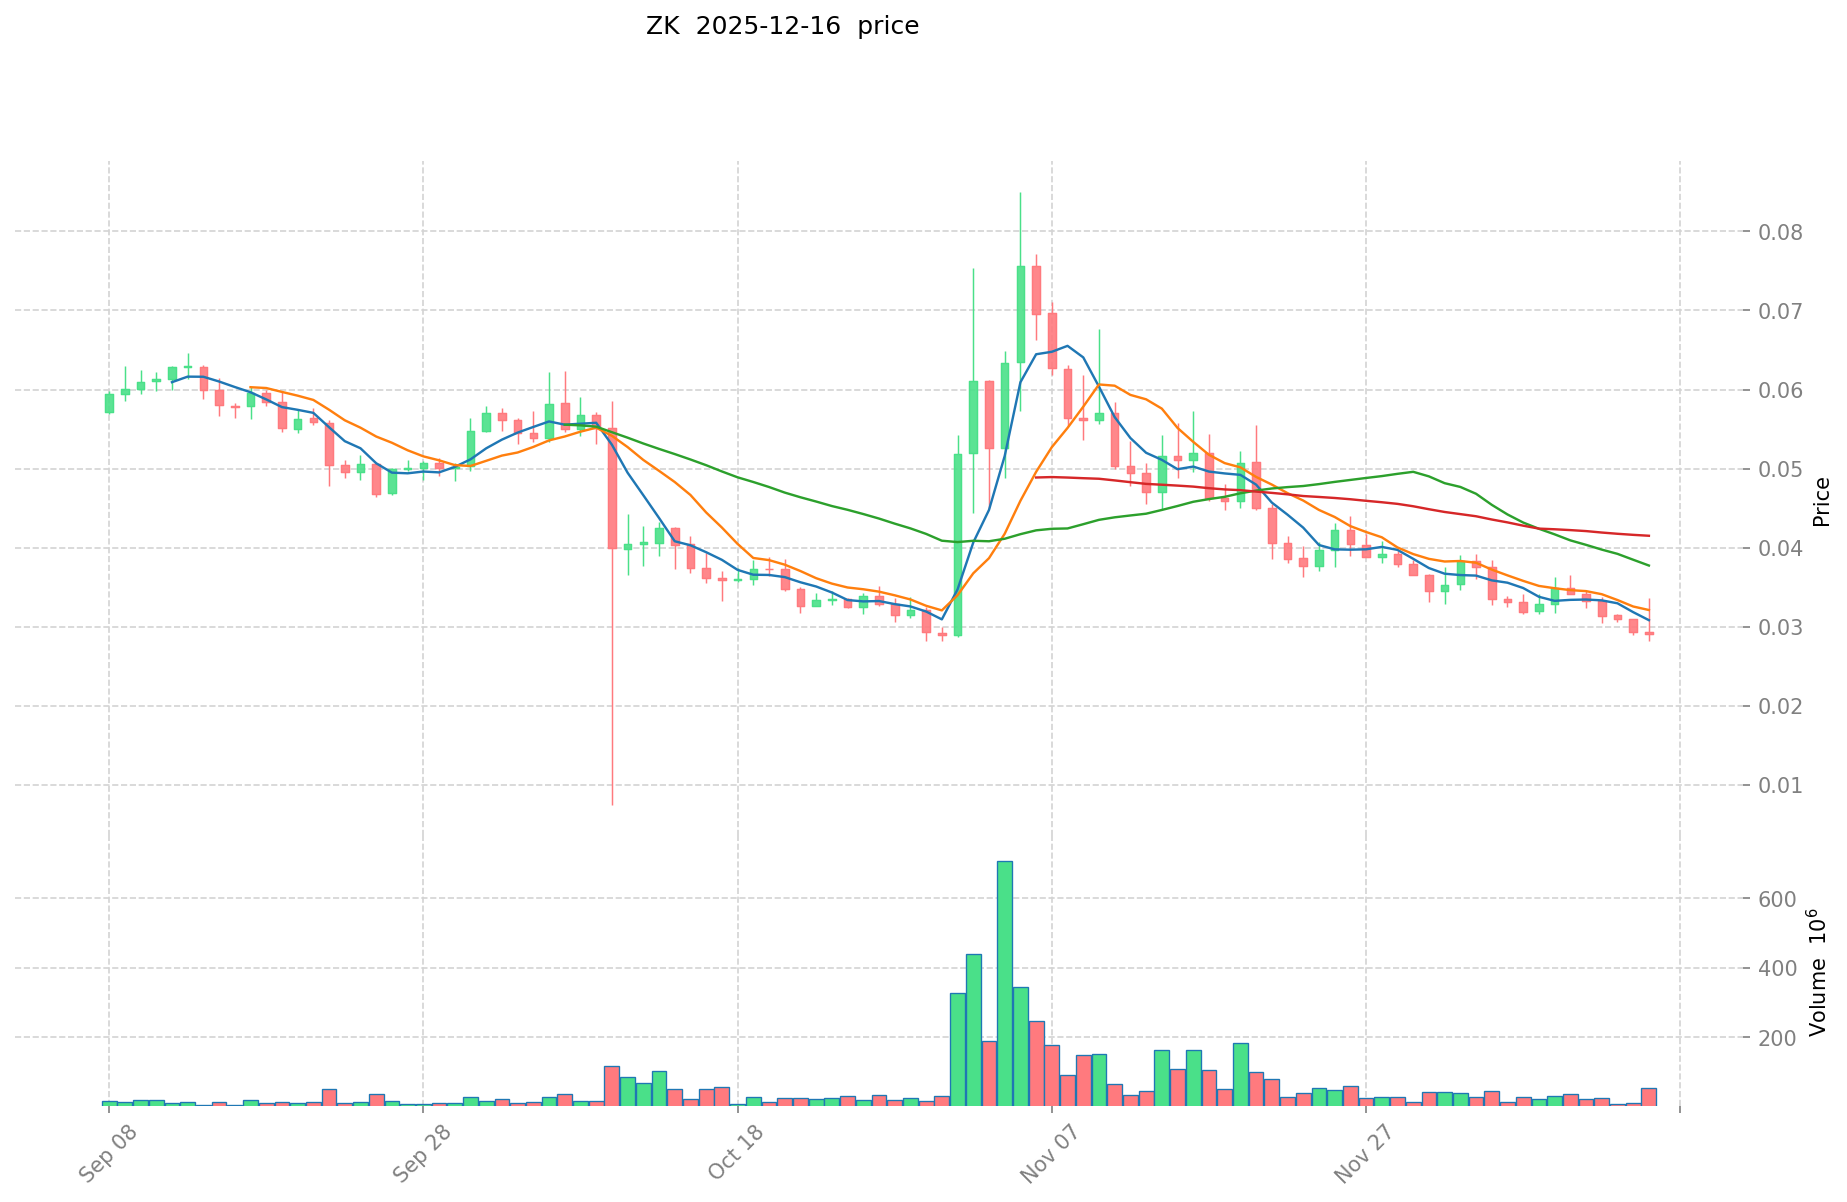
ZKsync (ZK) Performance:
- All-Time High: $0.367 (June 17, 2024)
- All-Time Low: $0.00736 (October 10, 2025)
- Current Price: $0.02913 (December 16, 2025)
- Year-to-Date Performance: -87.44%
VeChain (VET) Performance:
- All-Time High: $0.280991 (April 19, 2021)
- All-Time Low: $0.00191713 (March 13, 2020)
- Current Price: $0.01075 (December 16, 2025)
- Year-to-Date Performance: -81.67%
Comparative Analysis: Both tokens exhibit significant long-term depreciation from their historical peaks. ZK has declined from its recent ATH of $0.367 to $0.02913, representing a contraction of approximately 92%. VET has experienced a more extended bear cycle, falling from its 2021 peak of $0.280991 to current levels, though demonstrating relatively greater resilience in percentage terms over the past year compared to ZK.
Current Market Status (December 16, 2025)
Price Data:
- ZKsync (ZK) Current Price: $0.02913
- VeChain (VET) Current Price: $0.01075
24-Hour Trading Activity:
- ZK: $1,064,812.38 in 24-hour volume; -2.34% price change
- VET: $347,602.51 in 24-hour volume; -1.27% price change
Market Capitalization:
- ZK: Market Cap $249.58 million (Rank #200); Fully Diluted Valuation: $611.73 million
- VET: Market Cap $924.34 million (Rank #87); Fully Diluted Valuation: $924.34 million
Market Sentiment Indicator (Fear & Greed Index): 11 (Extreme Fear)
Real-Time Price Resources:
- View ZK Current Price: Gate Market Data
- View VET Current Price: Gate Market Data
II. Price Movement Analysis
Short-Term Price Trends
ZKsync (ZK) - December 16, 2025:
- 1-Hour Change: +0.21%
- 24-Hour Change: -2.34%
- 7-Day Change: -13.94%
- 30-Day Change: -46.54%
VeChain (VET) - December 16, 2025:
- 1-Hour Change: +1.03%
- 24-Hour Change: -1.27%
- 7-Day Change: -13.76%
- 30-Day Change: -30.36%
Observation: Both assets demonstrate downward pressure over medium-term horizons (7-30 days), with VET showing relatively better performance in the 30-day window (-30.36% vs ZK's -46.54%).
III. Supply and Circulation Metrics
Token Economics
ZKsync (ZK):
- Circulating Supply: 8,567,774,770 ZK (40.80% of total supply)
- Total Supply: 21,000,000,000 ZK
- Max Supply: 21,000,000,000 ZK
- Token Holders: 339,288
VeChain (VET):
- Circulating Supply: 85,985,041,177 VET (99.16% of total supply)
- Total Supply: 85,985,041,177 VET
- Max Supply: 86,712,634,466 VET
- Token Holders: 14,321,498
Comparative Observation: VET demonstrates significantly higher circulating supply in absolute terms and maintains near-complete circulation of its token supply. ZK retains substantial unissued tokens (59.20% of total supply remains undistributed), which represents potential future dilution risk. VET's holder base is substantially larger (14.3 million vs 339,288), indicating broader distribution and community engagement.
IV. Market Position and Liquidity
Exchange Listing and Trading Infrastructure
ZKsync (ZK):
- Listed on 50 exchanges
- Market Dominance: 0.019%
- Market Cap to FDV Ratio: 40.8%
VeChain (VET):
- Listed on 40 exchanges
- Market Dominance: 0.029%
- Market Cap to FDV Ratio: 99.16%
Analysis: ZK maintains presence on more exchange venues but shows lower fully diluted valuation capture relative to current market cap, suggesting significant potential supply pressure. VET's nearly 100% circulation ratio indicates minimal future dilution risk and more mature token economics.
V. Ecosystem and Technical Specifications
Project Overview
ZKsync:
- Classification: Ever-expanding verifiable blockchain network, secured by mathematics
- Focus: Zero-knowledge proof technology and layer-2 scaling solutions
- Consensus Algorithm: ZKsync Protocol
VeChain:
- Founding: Established in 2015 by Sunny Lu
- Primary Use Case: Supply chain transparency and anti-counterfeiting solutions
- Enterprise Partnerships: DNV, Walmart, Boston Consulting Group
- Layer-1 Platform: VeChainThor blockchain
- Strategic Initiative: Renaissance roadmap featuring Ethereum-compatible infrastructure, delegated Proof-of-Stake consensus mechanism, dynamic VTHO tokenomics, and StarGate NFT staking framework
- Regulatory Compliance: MiCA-compliant token architecture with enhanced cross-chain interoperability
VI. Risk Assessment
Key Considerations
ZKsync:
- Significant unreleased token supply may create downward price pressure upon future distribution
- Concentrated holder base relative to token distribution breadth
- High sensitivity to zero-knowledge proof technology adoption rates
VeChain:
- Extended bear market from 2021 ATH suggests challenging market conditions for the project thesis
- Dependence on enterprise adoption in supply chain sector
- Year-to-date performance of -81.67% indicates substantial investor losses
Market Sentiment Context
The current Crypto Fear & Greed Index reading of 11 (Extreme Fear) suggests depressed market conditions affecting both assets broadly, transcending individual project fundamentals.
Report Date: December 16, 2025
Data Sources: Gate Market Data, Referenced Exchange APIs
Disclaimer: This report provides factual market data and comparative analysis only. It does not constitute financial advice or investment recommendations.

Investment Value Analysis: VeChain (VET) and Aave (AAVE)
I. Executive Summary
Based on available research materials, this report examines the core investment value drivers for VeChain (VET) and Aave (AAVE) as of December 2025. Both projects demonstrate fundamental strength but exhibit significant valuation gaps relative to their operational metrics and market adoption levels.
II. Core Factors Influencing VET and AAVE Investment Value
Supply Mechanism and Tokenomics
VeChain (VET):
- Token supply structure supports enterprise applications in supply chain management
- Daily active accounts recorded at 4,353 (as of May 2020 data)
- Supply mechanism designed for sustainability-focused use cases
Aave (AAVE):
- Governance token with limited direct fee-sharing mechanisms to token holders
- AAVE holders do not automatically receive protocol fees, though staking in the Safety Module provides some incentives
- Recent introduction of stablecoin GHO creates additional revenue streams
- Supply structure reflects governance focus rather than direct yield distribution
📌 Historical Pattern: Traditional governance tokens without direct cash flow benefits often experience delayed price appreciation relative to protocol growth, as demonstrated by AAVE's current valuation relative to 2021 peaks.
Institutional Adoption and Market Application
Enterprise Adoption:
-
VeChain: Demonstrates real-world deployment across multiple sectors including food safety, sustainable fashion, and cross-border supply chain management. Enterprise partnerships include Walmart and BMW, with dozens of additional pilots underway. The partnership network creates a competitive moat that makes rapid replication difficult for new projects.
-
Aave: Maintains dominance in decentralized finance lending with approximately USD 30 billion in liquidity as of 2025. Serves as the foundational layer for traders, yield farmers, and institutional participants in DeFi. Generates transaction fees second only to Lido on Ethereum (excluding stablecoin networks), indicating substantial user interaction volume.
Market Position:
- VeChain: USD 230 million market cap, USD 125 million in additional metrics (as of May 2020)
- Aave: Price/Sales ratio of approximately 39x, significantly lower than comparable lending platforms (Compound, Maple at 50x+), indicating conservative market pricing relative to fee generation
Technology Development and Ecosystem Building
VeChain Technical Progress:
- VeChainThor blockchain operates as a public Layer 1 network
- Implementation of POA 2.0 algorithm
- Expanding real-world application deployments across food safety, sustainable fashion, and supply chain sectors
- Technology addresses actual enterprise problems with demonstrated adoption
Aave Ecosystem Evolution:
- Aave v3 introduced efficiency improvements and new functionality
- GHO stablecoin launch creates additional revenue diversification
- Flash loans and credit delegation represent innovative DeFi primitives
- Community governance structure enables future value distribution mechanisms (fee sharing, buyback programs)
Ecosystem Comparison:
- VeChain: Specialized in supply chain and sustainability applications; enterprise-focused deployment model
- Aave: Core DeFi infrastructure; integration across multiple blockchain networks; Total Value Locked expanded from approximately USD 15 billion in early 2025 to USD 30 billion by mid-year
Macroeconomic Context and Market Cycle Dynamics
Valuation Disconnect:
-
VeChain: Token price appreciation has not synchronized with expanding real-world application footprint. Represents a bet on "utility eventually overcoming hype" for patient investors.
-
Aave: TVL nearly doubled from USD 15 billion to USD 30 billion, yet token price remains at a fraction of 2021 highs (approximately USD 600+). P/S ratio of 39x versus 50x+ for competitors suggests market has priced conservative growth assumptions despite actual usage expansion.
Market Sentiment Factors:
- Post-2022 bear market risk aversion has disproportionately affected DeFi token valuations
- Layer 2 projects emerging as focus area for blockchain innovation in 2024-2025 period
- Broader crypto market transition from speculative to utility-based valuations underway
III. Key Observations on Valuation Gaps
Both VET and AAVE exhibit characteristic undervaluation patterns where:
- Operational metrics exceed market pricing: Usage growth, revenue generation, and enterprise adoption outpace token price appreciation
- Enterprise legitimacy: VeChain's Walmart/BMW partnerships and Aave's position as second-largest Ethereum business (by revenue) demonstrate real-world traction
- Ecosystem maturity: Established user bases, proven technology infrastructure, and recurring revenue streams
- Market perception lag: Risk-off sentiment from previous cycle failures has suppressed valuations across quality DeFi and enterprise infrastructure projects
IV. Investment Thesis Summary
The research materials indicate both projects demonstrate "strong fundamentals not yet fully recognized by markets." The valuation gaps between actual usage metrics and token pricing suggest potential revaluation scenarios:
- VeChain: Represents utility thesis where enterprise supply chain adoption materializes into demand
- Aave: Represents infrastructure thesis where DeFi market recovery drives institutional participation and potential protocol fee distribution enhancements
Both depend on market cycle progression from current risk-off positioning toward recognition of utility-based value propositions.
Report Date: December 16, 2025
Data Source: Referenced materials based on 2020-2025 period research and analysis
III. 2025-2030 Price Forecast: ZK vs VET
Short-term Forecast (2025)
- ZK: Conservative $0.0180854-$0.02917 | Optimistic $0.040838
- VET: Conservative $0.0077544-$0.01077 | Optimistic $0.0156165
Medium-term Forecast (2027-2028)
- ZK is expected to enter a growth consolidation phase, with projected price range of $0.0284565018-$0.060612348834
- VET is expected to enter an early appreciation phase, with projected price range of $0.010128141387-$0.021527426025
- Key drivers: institutional capital inflows, ETF adoption, ecosystem development, zero-knowledge technology integration
Long-term Forecast (2030)
- ZK: Base case scenario $0.034813705644496-$0.057071648597535 | Optimistic scenario $0.083895323438376
- VET: Base case scenario $0.01504123947295-$0.020604437634178 | Optimistic scenario $0.029464345816874
Disclaimer: Price predictions are based on historical data analysis and statistical models. Cryptocurrency markets are highly volatile and unpredictable. These forecasts should not be considered financial or investment advice. Past performance does not guarantee future results. Investors should conduct their own research and consult with qualified financial advisors before making investment decisions.
ZK:
| 年份 | 预测最高价 | 预测平均价格 | 预测最低价 | 涨跌幅 |
|---|---|---|---|---|
| 2025 | 0.040838 | 0.02917 | 0.0180854 | 0 |
| 2026 | 0.04515516 | 0.035004 | 0.02520288 | 19 |
| 2027 | 0.0452899254 | 0.04007958 | 0.0284565018 | 37 |
| 2028 | 0.060612348834 | 0.0426847527 | 0.040550515065 | 46 |
| 2029 | 0.06249474642807 | 0.051648550767 | 0.02892318842952 | 76 |
| 2030 | 0.083895323438376 | 0.057071648597535 | 0.034813705644496 | 95 |
VET:
| 年份 | 预测最高价 | 预测平均价格 | 预测最低价 | 涨跌幅 |
|---|---|---|---|---|
| 2025 | 0.0156165 | 0.01077 | 0.0077544 | 0 |
| 2026 | 0.016095765 | 0.01319325 | 0.0117419925 | 22 |
| 2027 | 0.021527426025 | 0.0146445075 | 0.00966537495 | 36 |
| 2028 | 0.021160581112125 | 0.0180859667625 | 0.010128141387 | 68 |
| 2029 | 0.021585601331043 | 0.019623273937312 | 0.014324989974238 | 82 |
| 2030 | 0.029464345816874 | 0.020604437634178 | 0.01504123947295 | 91 |
Comparative Investment Analysis Report: ZKsync (ZK) vs VeChain (VET)
I. Investment Strategy Comparison: ZK vs VET
Long-Term vs Short-Term Investment Strategies
ZKsync (ZK): Suited for investors focusing on zero-knowledge proof technology adoption and layer-2 scaling ecosystem expansion. Long-term positioning targets technology infrastructure maturation with expected 95% appreciation potential by 2030 (base case scenario). Short-term investors should exercise caution given -46.54% 30-day performance and significant unreleased token supply (59.20% of total supply).
VeChain (VET): Suited for investors prioritizing enterprise adoption and real-world supply chain applications with demonstrated partnerships (Walmart, BMW, DNV). Long-term thesis depends on utility materialization over market cycles, with 91% appreciation potential by 2030 (base case scenario). Higher holder base (14.3 million) and near-complete circulation (99.16%) provide relatively greater stability for patient capital allocations.
Risk Management and Asset Allocation
Conservative Investors:
- ZK: 15-20% allocation | VET: 25-30% allocation
- Rationale: VET's mature token economics and enterprise partnerships provide relatively lower dilution risk; ZK's concentrated holder base and unreleased supply warrant cautious positioning
Aggressive Investors:
- ZK: 35-45% allocation | VET: 20-25% allocation
- Rationale: ZK offers higher volatility upside potential aligned with technology adoption thesis; VET maintains core position due to fundamental operational metrics
Hedging Instruments:
- Stablecoin allocation: 30-40% for both portfolio types to manage extreme fear sentiment (Fear & Greed Index: 11)
- Cross-asset diversification: Allocate 15-20% to established layer-1 protocols to reduce concentration risk
- Options strategy: Consider straddle positions during extreme volatility to capture price discovery across both assets
II. Risk Assessment Comparison
Market Risk
ZKsync (ZK):
- Severe token supply dilution risk: 59.20% of total supply remains undistributed, creating potential downward pressure upon future distribution phases
- Concentrated holder base (339,288 total holders) amplifies liquidity withdrawal risks during market downturns
- Year-to-date -87.44% performance indicates heightened sensitivity to market sentiment shifts
VeChain (VET):
- Extended bear market cycle from 2021 ATH ($0.280991) suggests extended recovery timeline
- Year-to-date -81.67% performance reflects broader market challenges rather than project-specific failures
- Distributed holder base (14.3 million) provides more resilient liquidity profile during redemption events
Technology Risk
ZKsync (ZK):
- Zero-knowledge proof technology adoption rates remain uncertain; theoretical elegance does not guarantee market acceptance
- Layer-2 scaling solution faces competition from alternative scaling approaches (optimistic rollups, sidechains)
- Protocol security dependent on mathematical correctness; implementation errors could trigger cascading value destruction
VeChain (VET):
- VeChainThor blockchain stability and network congestion management during enterprise adoption scaling
- POA 2.0 algorithm security model concentration among validator nodes
- Supply chain data integrity dependent on external oracle and partner integration quality
Regulatory Risk
Global Regulatory Environment (December 2025):
- European Union MiCA (Markets in Crypto-Assets Regulation) compliance: VET demonstrates enhanced positioning through Renaissance roadmap MiCA-compliant architecture; ZK's layer-2 status may reduce direct regulatory exposure but increases dependency on Ethereum base layer regulatory treatment
- United States regulatory clarity: DeFi protocols face ongoing scrutiny; enterprise-focused projects like VET benefit from tangible use case documentation
- Jurisdictional variation: Supply chain transparency projects (VET) receive more favorable regulatory treatment in jurisdictions prioritizing anti-counterfeiting frameworks; layer-2 infrastructure (ZK) faces variable regulatory classification across regions
III. Potential Valuation Scenarios (2025-2030)
Base Case Projections
ZKsync (ZK):
- 2025 Outlook: $0.0180854-$0.040838 (conservative to optimistic range)
- 2028 Consolidation: $0.040550515065-$0.060612348834
- 2030 Target: $0.034813705644496-$0.083895323438376 (95% appreciation potential at optimistic scenario)
VeChain (VET):
- 2025 Outlook: $0.0077544-$0.0156165 (conservative to optimistic range)
- 2028 Appreciation: $0.010128141387-$0.021160581112125
- 2030 Target: $0.01504123947295-$0.029464345816874 (91% appreciation potential at optimistic scenario)
Scenario Drivers (2027-2030)
Bullish Catalysts:
- Institutional capital inflows following regulatory clarity
- ETF approval and mainstream financial product integration
- ZK: Accelerated zero-knowledge technology adoption across DeFi and gaming applications
- VET: Expanded enterprise partnership deployment across food safety, pharmaceuticals, and luxury goods authentication
Bearish Catalysts:
- Regulatory crackdowns on layer-2 scaling solutions or enterprise blockchain applications
- Competitive technology displacement (alternative zero-knowledge implementations; blockchain-agnostic supply chain platforms)
- Macroeconomic recession reducing enterprise capital allocation to blockchain pilots
- Token supply shock from ZK's 59.20% undistributed supply triggering significant dilution
IV. Conclusion: Which Is the Better Buy?
Investment Value Summary
ZKsync (ZK) Advantages:
- Higher 2030 upside potential (95% appreciation optimistic scenario vs VET's 91%)
- Exposure to zero-knowledge proof technology infrastructure positioning within evolving layer-2 ecosystem
- Lower absolute price enables smaller position sizing for retail investors
- 50-exchange listing breadth indicates established market infrastructure
VeChain (VET) Advantages:
- Established enterprise adoption with documented partnerships (Walmart, BMW, DNV) reducing technology adoption uncertainty
- Near-complete token circulation (99.16%) minimizes future dilution risk
- Superior liquidity distribution across 14.3 million holders reduces withdrawal shock vulnerability
- MiCA-compliant architecture positioning for European regulatory environment
- Consistent -13.76% 7-day performance (better than ZK's -13.94%) suggests relative market resilience
Investment Recommendations
Beginner Investors:
- Recommended Strategy: Weighted allocation favoring VET (60-70%) combined with 30-40% stablecoin holdings, 0-10% exploratory ZK position
- Rationale: VET's enterprise partnerships and documented use cases reduce information asymmetry; stablecoin holdings capture current extreme fear sentiment (Fear & Greed Index: 11) for dollar-cost-averaging opportunities during market recovery phases
- Entry Point: Current market conditions present accumulation opportunities; initiate 25% of planned position, reserve 75% capital for scaled entry across 2025-2026 period
Experienced Investors:
- Recommended Strategy: 40-50% VET allocation for core position; 20-30% ZK allocation for technology adoption thesis; 20-30% dynamic allocation rotating between layer-2 protocols based on TVL and market sentiment metrics
- Advanced Tactics: Implement covered call strategies on VET holdings to generate income during consolidation phases; monitor ZK token unlock schedules for optimal entry/exit timing; establish limit orders at 2025 forecast price targets ($0.0180854 for ZK, $0.0077544 for VET) to execute predetermined allocation increases during downturns
Institutional Investors:
- Recommended Strategy: VET serves primary holding (50-60% allocation) reflecting regulatory compliance positioning and enterprise partnership network reducing execution risk; ZK allocation (15-20%) captures technology infrastructure upside; remaining capital (20-30%) allocated to DeFi protocols with revenue-generating mechanisms (Aave referenced in research materials as generating second-highest Ethereum business revenue)
- Risk Framework: Establish 20% portfolio volatility tolerance; implement quarterly rebalancing upon ±10% performance divergence from benchmarks; require six-month partnership or TVL verification periods before position increases
Report Date: December 16, 2025
Data Sources: Gate Market Data, Referenced Exchange APIs, Forecast Models Based on Historical Analysis
Disclaimer: This report provides factual market data and comparative analysis only. It does not constitute financial advice or investment recommendations. Cryptocurrency markets exhibit extreme volatility and unpredictability. Forecasted price scenarios represent statistical modeling outputs, not guaranteed outcomes. Past performance does not guarantee future results. Investors should conduct independent research and consult qualified financial advisors before making investment decisions. Regulatory environments remain in flux; positions may require adjustment following policy announcements. None
FAQ: ZKsync (ZK) vs VeChain (VET) Investment Comparison
I. What are the key differences in token supply between ZK and VET?
Answer: ZKsync (ZK) has a total supply of 21 billion tokens with only 40.80% in circulation (8.57 billion), leaving 59.20% undistributed and creating significant future dilution risk. VeChain (VET) maintains nearly complete circulation at 99.16% of its 85.99 billion token total supply, eliminating future dilution concerns. Additionally, VET has 14.3 million token holders compared to ZK's 339,288, indicating broader distribution and market resilience.
II. Which asset has demonstrated stronger enterprise adoption?
Answer: VeChain (VET) demonstrates significantly stronger enterprise adoption with documented partnerships including Walmart, BMW, and DNV across supply chain, food safety, and anti-counterfeiting applications. ZKsync (ZK) focuses on zero-knowledge proof technology infrastructure and layer-2 scaling solutions without comparable real-world enterprise deployment metrics. VET's utility is tangible and measurable, while ZK's value proposition remains dependent on theoretical technology adoption rates.
III. What is the investment outlook for each asset by 2030?
Answer: Both assets show appreciation potential by 2030 under base case scenarios. ZKsync (ZK) projects 95% potential appreciation to $0.034813-$0.083895, while VeChain (VET) projects 91% appreciation to $0.015041-$0.029464. However, these forecasts depend on critical drivers: for ZK, accelerated zero-knowledge technology adoption and institutional capital inflows; for VET, expanded enterprise partnership deployment and mainstream supply chain blockchain integration.
IV. Given current market conditions, which asset is better for conservative investors?
Answer: VeChain (VET) is more suitable for conservative investors due to: (1) mature token economics with 99.16% circulation eliminating dilution risk, (2) demonstrated enterprise partnerships reducing technology adoption uncertainty, (3) 14.3 million distributed holders providing market stability, and (4) MiCA-compliant architecture favorable for European regulatory environment. Conservative positioning recommends 60-70% VET allocation combined with 30-40% stablecoin holdings during current extreme fear sentiment (Fear & Greed Index: 11).
V. What specific risks should investors consider before buying ZK?
Answer: Key ZK risks include: (1) severe dilution risk from 59.20% undistributed token supply potentially creating downward price pressure, (2) highly concentrated holder base (339,288 total holders) amplifying liquidity withdrawal risks during market downturns, (3) zero-knowledge proof technology adoption remains uncertain despite theoretical elegance, (4) competitive pressure from alternative layer-2 scaling solutions (optimistic rollups, sidechains), and (5) year-to-date -87.44% performance indicating extreme volatility sensitivity.
VI. How do current market sentiment and regulatory environment affect these investments?
Answer: The current Crypto Fear & Greed Index reading of 11 (Extreme Fear) creates depressed valuations affecting both assets broadly, transcending individual project fundamentals and creating potential accumulation opportunities. Regulatory environment favors VET through Renaissance roadmap MiCA compliance positioning for European markets, while ZK faces variable regulatory classification across jurisdictions due to layer-2 infrastructure status. The regulatory clarity trajectory over 2025-2026 will significantly impact both assets' valuation trajectories.
VII. What is the optimal entry strategy for both assets in current market conditions?
Answer: Current market conditions present accumulation opportunities for dollar-cost-averaging strategies. Recommended approach: (1) initiate 25% of planned VET position immediately, reserving 75% for scaled entry across 2025-2026, (2) establish limit orders at conservative 2025 forecast price targets ($0.0077544 for VET, $0.0180854 for ZK), (3) allocate 30-40% portfolio to stablecoins for tactical deployment during price discovery phases, and (4) implement quarterly rebalancing upon ±10% performance divergence from personal benchmarks.
VIII. How does the 30-day price performance comparison inform investment decisions?
Answer: VeChain's -30.36% 30-day decline outperforms ZKsync's -46.54% decline, suggesting relatively better market resilience and resistance to downward pressure. This differential performance indicates VET maintains stronger liquidity dynamics and institutional/retail support despite broader market challenges. However, this short-term metric should not drive allocation decisions; long-term enterprise adoption fundamentals and token economics remain primary decision factors given the current extreme fear sentiment environment.
Report Date: December 16, 2025
Data Sources: Gate Market Data, Referenced Exchange APIs
Disclaimer: This FAQ provides factual market information and comparative analysis only. It does not constitute financial advice or investment recommendations. Cryptocurrency markets remain highly volatile and unpredictable. Investors should conduct independent research and consult qualified financial advisors before making investment decisions.
Share
How to Buy Cryptocurrency


Trending Cryptocurrencies


XZXX: A Comprehensive Guide to the BRC-20 Meme Token in 2025

Bitcoin Fear and Greed Index: Market Sentiment Analysis for 2025

Top Crypto ETFs to Watch in 2025: Navigating the Digital Asset Boom

5 ways to get Bitcoin for free in 2025: Newbie Guide

Bitcoin Market Cap in 2025: Analysis and Trends for Investors
2025 Bitcoin Price Prediction: Trump's Tariffs' Impact on BTC

Is Core DAO (CORE) a good investment?: A comprehensive analysis of tokenomics, governance, and growth potential in 2024

Is Prometeus (PROM) a good investment?: A Comprehensive Analysis of Market Performance, Technology, and Future Potential

Is Amp (AMP) a good investment?: A Comprehensive Analysis of Market Potential, Risk Factors, and Future Outlook

Is Zora (ZORA) a good investment?: A Comprehensive Analysis of the Digital Collectibles Platform's Potential and Market Outlook

W vs NEAR: A Comprehensive Comparison of Two Leading Blockchain Platforms