Understanding Wicks in Crypto Candlestick Trading

12-23-2025, 9:57:22 AM
Crypto Trading
Crypto Tutorial
K-line
Article Rating : 3
164 ratings
The article "Understanding Wicks in Crypto Candlestick Trading" explores the critical role of wicks in interpreting candlestick charts for informed trading decisions in financial markets. It addresses the significance of wicks, offering insights into market volatility, sentiment, and potential price reversals. The article is structured to guide traders in analyzing wick patterns, integrating them into broader technical analysis, and improving trade outcomes regardless of experience. Key topics include the anatomy of a candle, the strategic importance of wicks, and their incorporation into trading strategies, enhancing readers' market acumen. Keywords like candlestick, wicks, trading strategies, and market sentiment are effectively optimized for quick comprehension.
Understanding Wicks in Crypto Candlestick Trading

What Do the Wicks Mean in Candle Trading?

Understanding Wicks in Candle Trading

In financial markets, whether cryptocurrency or traditional assets, candlestick charts serve as fundamental tools for visualizing price action and market behavior. These charts, while initially appearing complex with their varied shapes and colors, contain valuable insights when properly interpreted. The wick, a seemingly minor component of candlestick formations, is actually a critically important element that reveals significant information about market dynamics and investor sentiment. Understanding what the wicks mean is essential for traders seeking to make informed decisions based on technical analysis.

The Anatomy of a Candle

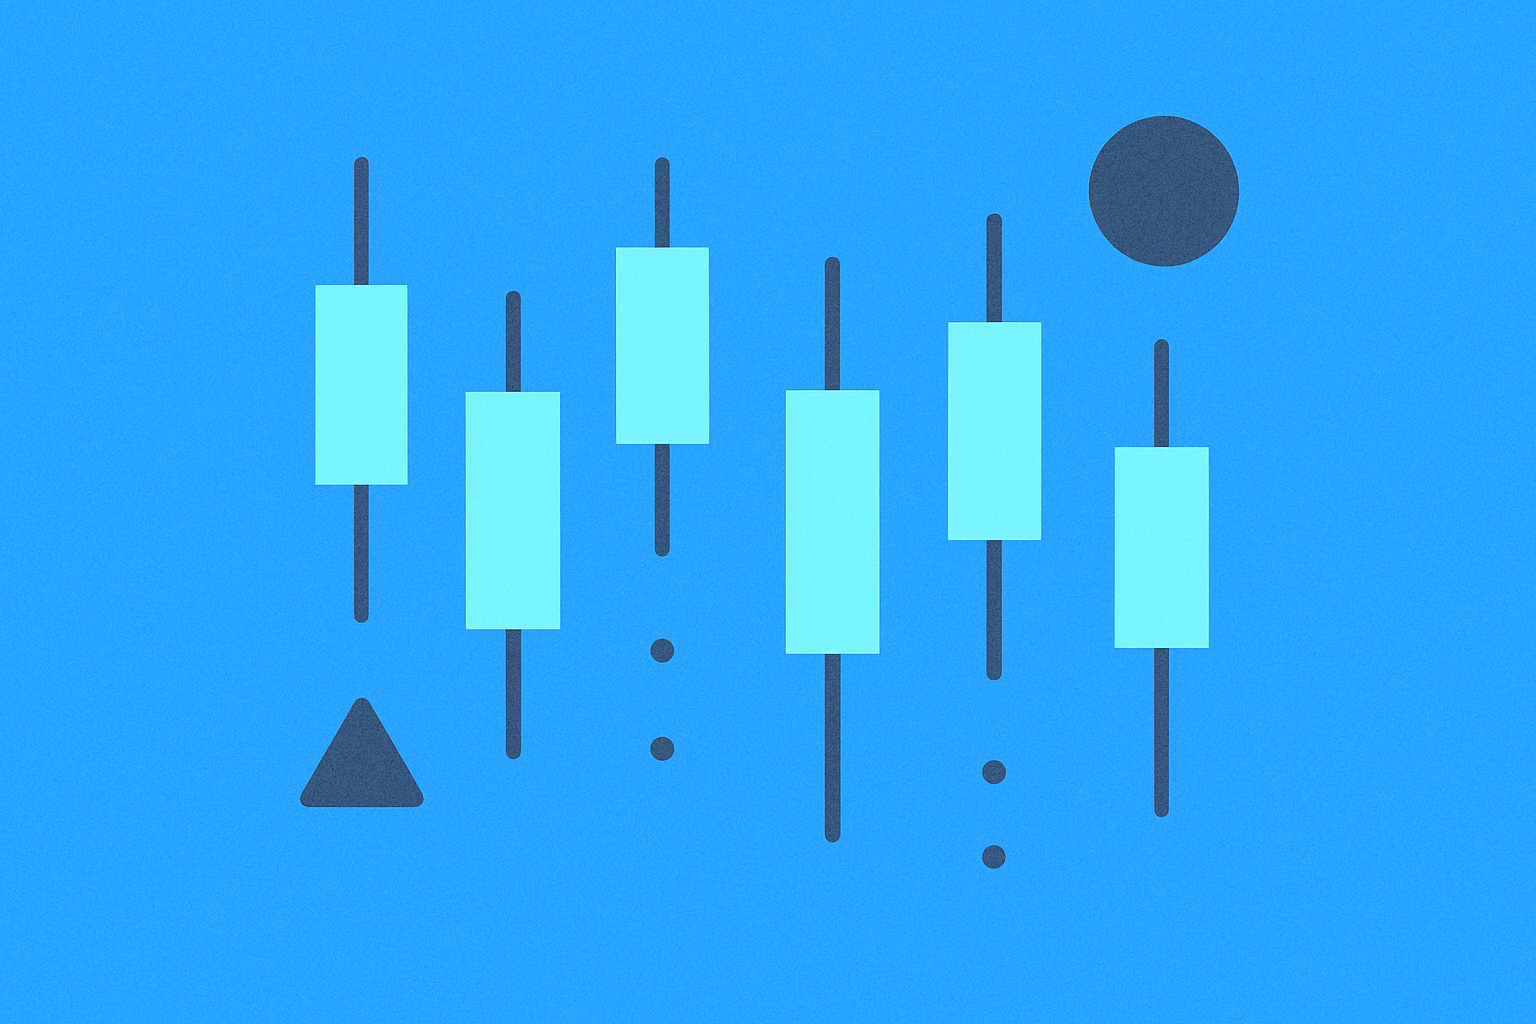
A candlestick is composed of two distinct structural elements: the body and the wick. These components work together to tell the complete story of price movement during a specific trading period.

The body of a candle represents the price range between opening and closing prices within a defined time frame. When the closing price exceeds the opening price, the body is typically rendered in green or white, representing bullish market conditions and upward momentum. When the opening price is higher than the closing price, the body appears in red or black, indicating bearish sentiment and downward pressure on prices.

The wick, also called a shadow, extends above and/or below the candle body and marks the highest and lowest prices reached during the trading period. The upper wick reaches to the session's high, while the lower wick extends to the session's low. These extensions provide critical information about price extremes that the body alone cannot convey, serving as visual indicators of market volatility and the full range of price exploration during each trading session.

The Significance of Wicks in Trading

Wicks provide traders with crucial insights into market sentiment and potential future price directions. They offer concrete data points that can signal market reversals, continuations, or trending conditions.

The length of a wick directly corresponds to market activity levels and volatility during the candle's formation period. Long wicks, whether upper or lower, indicate substantial price movement and market noise, frequently resulting from reactions to significant news events or major trades. Short wicks, conversely, suggest minimal price fluctuation and more stable market conditions.

Long upper wicks indicate that prices rose significantly during the session but faced selling pressure that drove them lower by the close. This formation is interpreted as bearish, suggesting that market participants lack confidence in maintaining elevated price levels. For example, if an asset opens at $100, rises to $110 during the session, but closes at $102, the upper wick clearly shows rejection of higher prices.

Long lower wicks reveal that prices fell sharply during the session but recovered before the close, typically interpreted as bullish. This pattern indicates that buyers are absorbing selling pressure and supporting prices. If the same asset had dropped to $95 during the session before recovering to close at $102, the lower wick would signal buyer support and potential bullish continuation.

Strategic Importance in Trade Decision-Making

Interpreting wicks effectively enables traders to anticipate market reactions and respond strategically to emerging price patterns. Wicks provide valuable clues about support and resistance levels, market equilibrium points, and potential breakout opportunities.

Wicks are fundamental to candlestick pattern recognition, many of which communicate distinct market signals. The hammer pattern features a small body with a long lower wick, typically appearing at market bottoms and suggesting potential trend reversals. The shooting star pattern displays a small body with a long upper wick, often signaling market tops and potential downward reversals. The doji pattern shows wicks on both sides with an almost nonexistent body, indicating market indecision and potential for significant directional shifts.

Effective risk management relies heavily on wick analysis. By carefully observing wick positions and lengths, traders can establish more accurate stop-loss and take-profit levels. In volatile markets such as digital assets, where rapid price changes occur frequently, properly identifying wick-based entry and exit points significantly reduces exposure to adverse price movements while preserving gains.

Incorporating Wicks in Your Trading Strategy

To maximize the analytical value of wick analysis, traders should integrate wick observation into a comprehensive technical analysis framework. Combining wick analysis with established indicators such as moving averages, the Relative Strength Index (RSI), or MACD provides a multidimensional perspective on market conditions and opportunities.

Employing a multi-timeframe analysis approach strengthens wick interpretation capabilities. By examining wicks across different time periods, traders gain broader context for price movements and enhance decision quality. A daily chart showing a long upper wick might suggest bearish sentiment, while the same period's hourly charts might reveal different dynamics, allowing traders to reconcile short-term fluctuations with longer-term trends and make more nuanced trading decisions.

Conclusion

Successful trading integrates analytical rigor with market understanding. Mastering wick analysis transforms candlestick interpretation from speculative guesswork into evidence-based decision-making. Wicks extend beyond mere price extremes—they communicate market sentiment, reveal turning points, and identify strategic opportunities. By incorporating wick analysis into systematic trading strategies, traders can significantly improve trading outcomes and develop deeper market acumen, regardless of experience level.

FAQ

What does the wick represent?

The wick on a candlestick chart represents the highest and lowest prices reached during a trading period, showing price fluctuations relative to the opening and closing prices of that timeframe.

How to interpret candle wicks?

Candle wicks represent price rejection at support or resistance levels. Long wicks indicate strong volatility and potential reversals. Traders use wicks to identify entry and exit opportunities, with wicks at key levels signaling market sentiment shifts and trend continuations.

What does a long upper wick mean?

A long upper wick indicates strong initial buying pressure, but sellers later pushed prices back down before the session ended. It shows a failed breakout attempt.

* The information is not intended to be and does not constitute financial advice or any other recommendation of any sort offered or endorsed by Gate.
Related Articles
What is M Pattern in Trading

What is M Pattern in Trading

This article offers a comprehensive guide to mastering the M Pattern, a key bearish reversal signal in cryptocurrency trading. It focuses on recognizing key components of the M Pattern, including the peaks, troughs, neckline, and volume dynamics, ensuring traders enhance their market strategies. Readers will learn proven strategies for trading the M Pattern, differentiating authentic signals from false ones, and improving risk management and potential profits. Tailored for crypto traders, this piece provides essential insights to navigate volatile markets with advanced technical analysis using Gate's tools.
8-29-2025, 5:20:33 AM
How to Read Crypto Charts: Beginner's Guide to Trading

How to Read Crypto Charts: Beginner's Guide to Trading

This beginner's guide to trading cryptocurrencies explains how to read crypto charts effectively. It covers the fundamentals of chart types — line, bar, and candlestick — and their impact on price movement analysis. The article delves into interpreting candlestick patterns for profitable trades and highlights essential technical indicators like Moving Averages, RSI, and MACD for comprehensive market analysis. It also explores advanced chart analysis techniques such as support, resistance, and market psychology, particularly useful for traders using Gate. This guide is perfect for new and experienced traders looking to enhance their trading strategies and market understanding.
9-18-2025, 4:23:32 AM
How to Use MACD, RSI, and KDJ Indicators for Crypto Trading?

How to Use MACD, RSI, and KDJ Indicators for Crypto Trading?

This article delves into the effective use of MACD, RSI, and KDJ indicators for crypto trading, offering insights into market trends and potential reversals. It evaluates these indicators, comparing their key signals and best use cases for optimizing trading strategies. The text explores how moving average crossovers signal trend shifts, emphasizing the significance of combining indicators for stronger confirmations and minimizing false signals. Additionally, volume and price divergence analysis are highlighted to enhance trend prediction accuracy. Aimed at traders seeking improved technical analysis methods, this comprehensive guide is structured to increase profitability and strategic trading efficiency.
10-25-2025, 10:21:15 AM
How to Interpret MACD, RSI, and KDJ Indicators for Crypto Technical Analysis?

How to Interpret MACD, RSI, and KDJ Indicators for Crypto Technical Analysis?

This article explores the interpretation of MACD, RSI, and KDJ indicators in crypto technical analysis, providing essential insights for traders on Gate. It addresses challenges of volatile market conditions and offers a combined approach with price and volume analysis for greater accuracy in predicting market trends. Key problems solved include detecting trend strength, identifying overbought/oversold conditions, and signaling potential reversals. The structure focuses on understanding these indicators, moving average crossovers, and volume-price divergence, enhancing readability for quick scanning and efficient decision-making.
11-19-2025, 9:42:23 AM
How to Interpret MACD, RSI, and Moving Averages for Crypto Trading Signals?

How to Interpret MACD, RSI, and Moving Averages for Crypto Trading Signals?

This article explores crucial cryptocurrency trading indicators—MACD, RSI, Moving Averages, and Bollinger Bands—focusing on their interpretation for recognizing entry and exit points. It addresses traders' need for reliable signals amidst market volatility, with particular emphasis on ChainOpera AI's trading patterns. Readers will understand the indicators' roles, see practical examples, and learn the importance of volume-price analysis in anticipating market shifts. Keywords such as MACD, RSI, Moving Averages, and Volume-price convergence ensure enhanced readability and quick comprehension for crypto traders.
11-17-2025, 12:48:44 PM
How to Use ADX Indicator for Crypto Trading: A Comprehensive Guide

How to Use ADX Indicator for Crypto Trading: A Comprehensive Guide

This article serves as a comprehensive guide to using the ADX indicator for crypto trading, emphasizing its power in measuring trend strength and avoiding choppy markets. It explores key levels and decision points at 25 and 50, essential for identifying profitable trading opportunities. Readers will understand how to integrate ADX with DI lines for precise signals indicating trend direction, improving trading efficiency. The content is tailored for traders seeking to enhance their market strategies using quantifiable metrics, ensuring reliability in dynamic crypto environments like Gate. Keywords such as ADX, trend strength, and DI lines are featured for optimal readability.
10-31-2025, 9:43:41 AM
Recommended for You
What is DIAM: A Comprehensive Guide to Direct Imaging and Multiwavelength Analysis

What is DIAM: A Comprehensive Guide to Direct Imaging and Multiwavelength Analysis

This comprehensive guide explores Diamante (DIAM), a blockchain project aimed at democratizing the digital economy with accessible and secure technology. It details DIAM's origin, milestones, decentralized operations, and market performance, highlighting its innovative approach to financial inclusion. The guide covers key metrics like market cap and trading volume, providing insights into DIAM's current position and potential growth. Readers interested in decentralized finance and blockchain technology will benefit from understanding DIAM's ecosystem, tokenomics, and risk considerations outlined in the report.
12-23-2025, 9:42:38 PM
What is GME: A Comprehensive Guide to GameStop's Stock Phenomenon and Its Impact on Wall Street

What is GME: A Comprehensive Guide to GameStop's Stock Phenomenon and Its Impact on Wall Street

This article offers a comprehensive guide to the GameStop (GME) phenomenon as a community-driven token on the Solana blockchain, emphasizing its market performance, technical architecture, and community dynamics. Aimed at cryptocurrency investors and enthusiasts, it addresses the rise of tokenized assets, analyzing market trends, volatility, and community impact. The structure covers GME's origin, blockchain operation, market metrics, and community engagement. With a focus on trading strategies and risk assessment, the article serves as an essential resource for understanding GME, specifically available on Gate, within the larger crypto ecosystem.
12-23-2025, 9:41:56 PM
What is SIS: A Comprehensive Guide to Student Information Systems and Their Role in Modern Education

What is SIS: A Comprehensive Guide to Student Information Systems and Their Role in Modern Education

The article provides an in-depth analysis of Symbiosis Finance (SIS), a decentralized multi-chain liquidity protocol. It highlights its role in addressing liquidity fragmentation across blockchain networks by facilitating efficient cross-chain asset transfers, while ensuring user custody and minimizing slippage. Key topics include the protocol's architecture, market performance, and community engagement, essential for blockchain enthusiasts and investors. With sections on token economics, trading opportunities via Gate, and technical security measures, the article offers comprehensive insights into SIS's position in the DeFi ecosystem.
12-23-2025, 9:41:54 PM
What is ROA: A Comprehensive Guide to Understanding Return on Assets

What is ROA: A Comprehensive Guide to Understanding Return on Assets

The article provides a comprehensive guide to ROA CORE, a Web3 ecosystem transforming everyday activities into blockchain value using the Solana blockchain. It covers ROA's origins, ecosystem mechanics, token economics, market performance, and strategic positioning in the Web3 space. The report addresses the need for real-world utility in blockchain by detailing how ROA CORE connects physical actions with digital assets. Key sections highlight market metrics, technical architecture, and potential risks, making it valuable for investors and users interested in blockchain applications. Featuring Gate as the main exchange, it enhances readability for those seeking an innovative approach to asset utilization.
12-23-2025, 9:41:13 PM
What is XTER: A Comprehensive Guide to Understanding the Next Generation of Cross-Chain Technology

What is XTER: A Comprehensive Guide to Understanding the Next Generation of Cross-Chain Technology

This comprehensive guide explores Xterio (XTER), a global play-and-earn gaming platform integrating Web3 technology. The article delves into Xterio's significance, tokenomics, market performance, and community engagement, crucial for understanding its impact on the gaming ecosystem. It addresses the challenges in digital asset ownership, offering insights for investors and players interested in decentralized gaming. The structure covers Xterio's origins, infrastructure, and strategic positioning, emphasizing key metrics and trading accessibility on Gate. Ideal for gaming enthusiasts and crypto investors, it presents a thorough understanding of XTER's role in the evolving GameFi sector.
12-23-2025, 9:40:57 PM
A Beginner’s Guide to Ripple Technology and XRP: Essential Information You Should Know

A Beginner’s Guide to Ripple Technology and XRP: Essential Information You Should Know

Explore Ripple technology and the XRP token for beginners, including their application in cross-border payments. Connect with traders on Gate to discover the benefits of XRP as a bridge currency, its low transaction fees, and its strong potential in global financial transfers.
12-23-2025, 9:40:20 PM