BTR vs OP: A Comprehensive Comparison of Performance, Features, and Use Cases


Introduction: BTR vs OP Investment Comparison
In the cryptocurrency market, the comparison between Bitlayer (BTR) and Optimism (OP) is a topic investors cannot avoid. The two differ significantly in market capitalization ranking, application scenarios, and price performance, representing different positioning within the crypto asset landscape. Bitlayer (BTR): Since its launch, it has gained market recognition by pioneering the first BitVM implementation, combining unparalleled security with a high-speed smart contract engine to unlock the full potential of Bitcoin DeFi. Optimism (OP): As a low-cost, lightning-fast Ethereum Layer 2 blockchain launched in 2022, it has established itself as a major player in scaling Ethereum and enabling developer and user adoption through practical solutions. This article will comprehensively analyze the investment value comparison between BTR and OP from multiple dimensions including historical price performance, supply mechanisms, institutional adoption, and technical ecosystems, while attempting to address the question investors care most about:
"Which is the better buy right now?"
Comparative Analysis Report: Bitlayer (BTR) and Optimism (OP)
I. Price History Comparison and Market Status
Historical Price Trends of BTR and OP
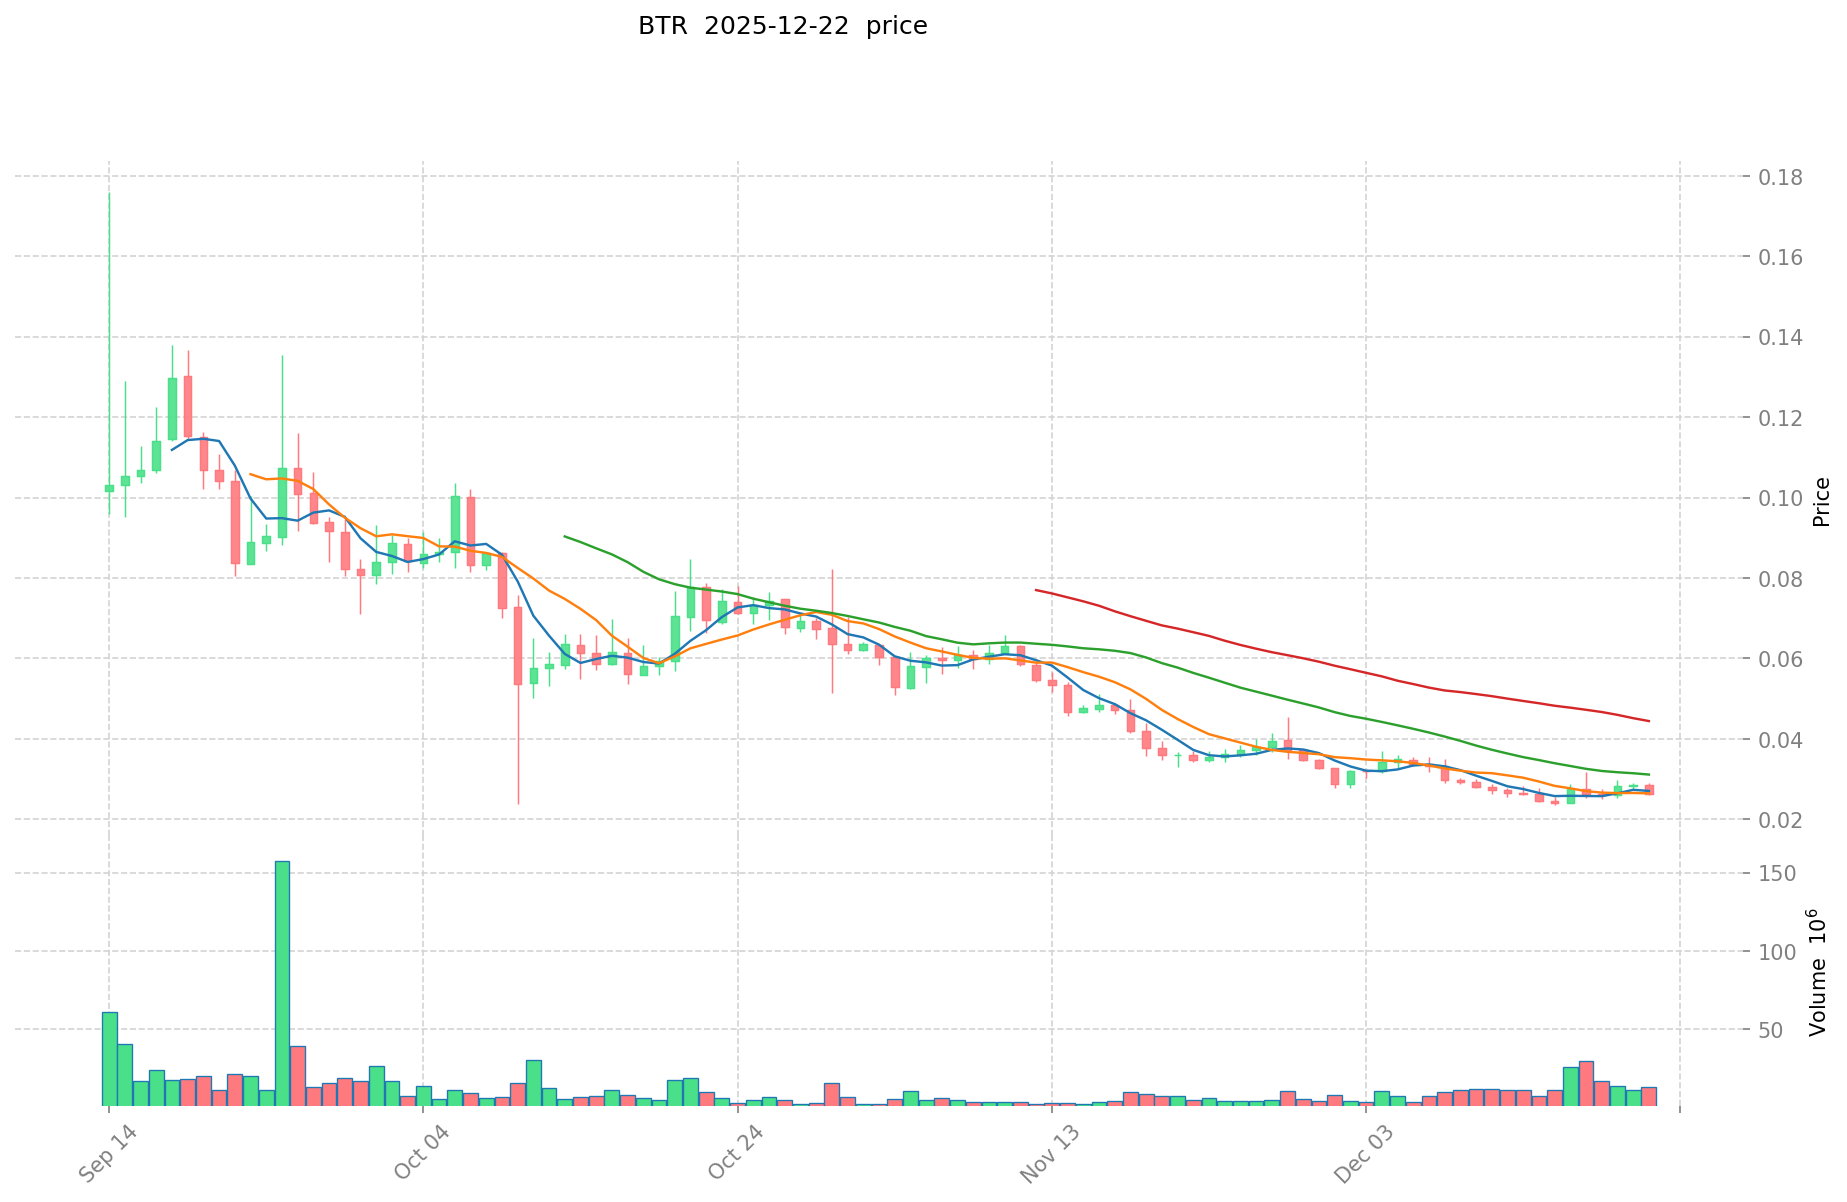
Bitlayer (BTR):
- All-Time High (ATH): $0.176 (September 14, 2025)
- All-Time Low (ATL): $0.02345 (December 15, 2025)
- Current Price: $0.02799 (December 23, 2025)
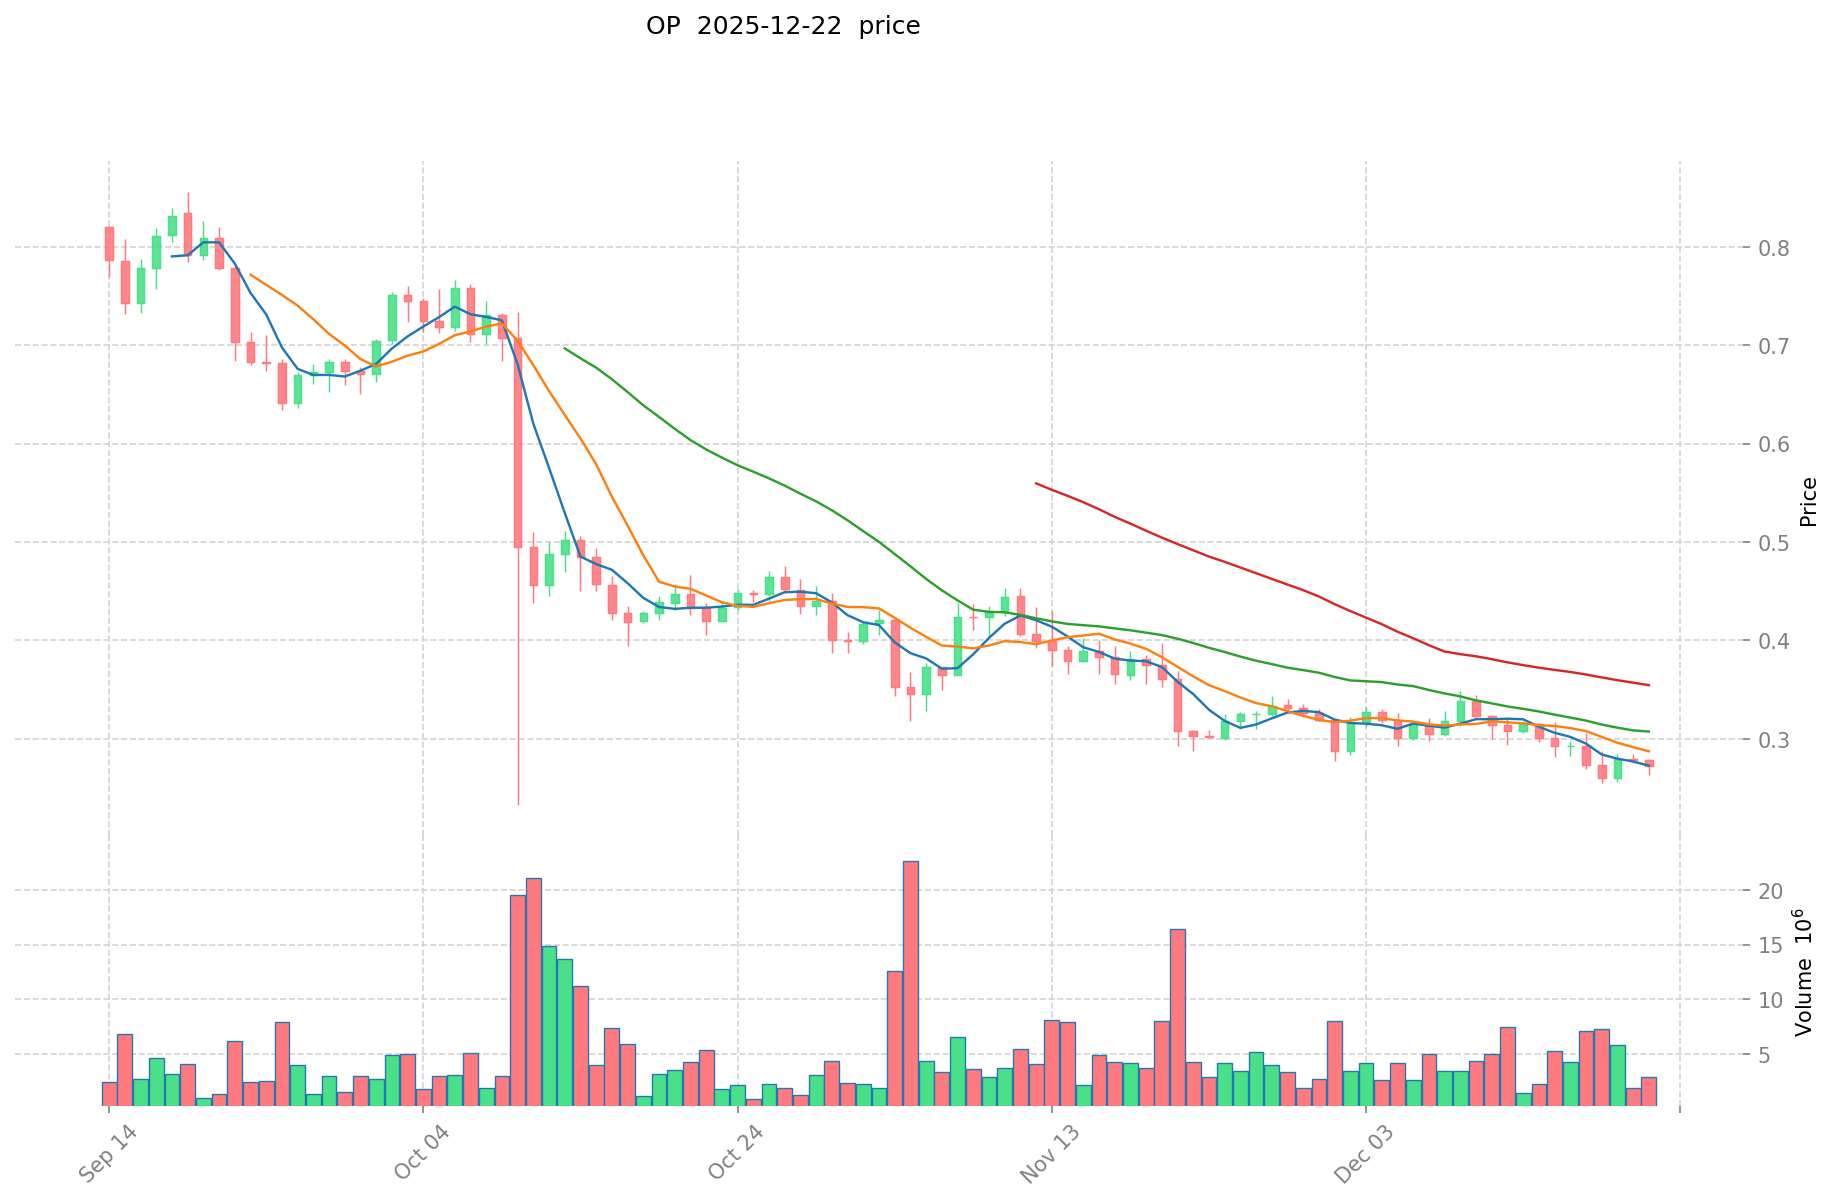
Optimism (OP):
- All-Time High (ATH): $4.84 (March 6, 2024)
- All-Time Low (ATL): $0.256066 (December 19, 2025)
- Current Price: $0.2752 (December 23, 2025)
Comparative Analysis
BTR has experienced significant volatility since its publication date, declining approximately 84.1% from its ATH to current levels within the same calendar year. The token has recently tested new lows, suggesting ongoing market pressure. In contrast, OP has demonstrated a more prolonged downtrend from its March 2024 peak, with a total decline of approximately 84.3% year-over-year, indicating similar pressure across Layer 2 solutions despite different market entry phases.
Current Market Status (December 23, 2025)
| Metric | BTR | OP |
|---|---|---|
| Current Price | $0.02799 | $0.2752 |
| 24-Hour Change | +4.28% | +1.77% |
| 7-Day Change | +14.57% | -4.38% |
| 30-Day Change | -20.51% | -8.20% |
| 1-Year Change | -86.40% | -84.26% |
| 24-Hour Trading Volume | $297,793.11 | $977,143.74 |
| Market Cap | $7,322,184 | $535,014,255 |
| Circulating Supply | 261,600,000 | 1,944,092,497 |
| Market Dominance | 0.00086% | 0.036% |
Market Sentiment Indicator
Crypto Fear & Greed Index: 25 (Extreme Fear)
This indicates a risk-averse market environment, with investors demonstrating heightened caution. Such sentiment typically correlates with increased volatility and defensive positioning across digital asset markets.
Current Price References:
- BTR: Market Data
- OP: Market Data
II. Project Fundamentals and Technical Architecture
Bitlayer (BTR) - Bitcoin Layer 2 Solution
Core Technology: Bitlayer pioneers the first BitVM implementation, combining native Bitcoin security with a high-throughput smart contract engine. The platform constructs three primary infrastructure components:
I. Trust-minimized BitVM cross-chain bridge II. Yield-bearing asset (YBTC) III. High-throughput Bitcoin Rollup
Funding and Support:
- Total raised: $30 million
- Lead investors: Polychain Capital, Franklin Templeton, Framework, ABCDE, StarkWare, and Alliance
- Token standard: BTR-20
Optimism (OP) - Ethereum Layer 2 Solution
Core Technology: Optimism operates as an Ethereum Layer 2 scaling solution utilizing Optimistic Rollup technology. The platform prioritizes simplicity, pragmatism, and sustainability, processing transactions with reduced fees while maintaining Ethereum's security guarantees.
Governance and Structure:
- OP serves as the native governance token for the Optimism Collective
- Managed by the Optimism Foundation
- Used for protocol upgrades, network parameter management, and ecosystem incentive mechanisms
- Supported by 97+ protocols including Synthetix, Uniswap, and Velodrome
- Total locked value (TVL) exceeds $500 million
III. Market Performance and Volatility Analysis
Price Volatility Characteristics
BTR Volatility:
- 1-Hour: -0.069%
- 24-Hour: +4.28% (positive momentum)
- Weekly volatility demonstrates 14.57% gains over 7 days, followed by -20.51% depreciation over 30 days
- Indicates high short-term volatility with significant intraday fluctuation potential
OP Volatility:
- 1-Hour: -0.79%
- 24-Hour: +1.77%
- Weekly performance shows -4.38% decline, with -8.20% monthly depreciation
- Demonstrates more moderate volatility compared to BTR but sustained downward pressure
Market Liquidity and Trading Activity
BTR exhibits considerably lower trading volume ($297,793) relative to its market capitalization, indicating limited liquidity and potentially wider bid-ask spreads. OP maintains substantially higher trading volume ($977,144), reflecting deeper liquidity pools and more active trading participation across multiple exchanges.
IV. Holder Distribution and Market Structure
BTR Holder Base:
- Total addresses: 37,448
- Circulating supply ratio: 26.16% (261.6M of 1B total supply)
- Listed on 19 exchanges
- Network concentration: Market shows early-stage distribution patterns
OP Holder Base:
- Total addresses: 1,357,251
- Circulating supply ratio: 45.26% (1.944B of 4.295B total supply)
- Broader holder distribution reflecting longer market history
- Ecosystem integration: 97+ supported protocols
V. Risk Assessment and Market Considerations
Identified Risk Factors
I. Extreme Market Sentiment: The Fear & Greed Index at 25 indicates heightened market anxiety, potentially amplifying volatility and downside risk.
II. Significant Drawdowns: Both assets have experienced substantial depreciation from peaks, with BTR declining 84.1% and OP declining 84.3%, indicating prolonged bear market conditions.
III. Limited Liquidity (BTR): Notably low trading volume relative to market cap suggests potential challenges with position liquidation and execution.
IV. Token Inflation: OP experiences 2% annual supply inflation, creating sustained selling pressure from token emission.
V. Layer 2 Market Competition: Both projects operate within competitive Layer 2 ecosystems facing technological and adoption challenges.
Market Differentiation
BTR targets Bitcoin's DeFi ecosystem through native security architecture, representing an emerging narrative in Bitcoin-centric infrastructure development. OP operates in the more mature Ethereum Layer 2 space with established protocol integrations and TVL figures.
Report Date: December 23, 2025 Data Accuracy Note: Price data reflects real-time market conditions as of report generation. Market sentiment and technical metrics are subject to rapid fluctuation.
Comparative Analysis: BTR vs OP Investment Value Assessment
I. Executive Summary
This report analyzes the core investment value factors for Bitlayer (BTR) and Optimism (OP) based on available reference materials. The analysis reveals that BTR represents Bitcoin Layer 2 infrastructure innovation, while OP demonstrates established blockchain ecosystem infrastructure. Both projects derive their investment theses from technological advancement and market adoption dynamics.
II. Core Factors Influencing BTR vs OP Investment Value
Technological Infrastructure & Innovation
BTR (Bitlayer):
- Layer 2 solution specifically engineered to address Bitcoin's fundamental limitations
- Native token BTR functions as the governance and ecosystem incentive mechanism within the Bitlayer ecosystem
- Raised $29 million USD in funding, indicating institutional backing for the technical vision
- Value proposition centers on extending Bitcoin's capabilities through scaling solutions
OP (Optimism):
- Robust infrastructure foundation within the broader blockchain ecosystem
- Established partnerships demonstrating integration depth across the DeFi and application layer
- Value driven by infrastructure maturity and network effects from existing ecosystem participants
Ecosystem Development & Market Position
- BTR ecosystem focus: Governance participation and ecosystem incentive distribution for Bitcoin Layer 2 participants
- OP ecosystem breadth: Institutional partnerships and multi-chain ecosystem integration position it as infrastructure-layer protocol
- Competitive dynamics: BTR targets Bitcoin-specific scaling while OP operates as general-purpose Layer 2 infrastructure
Community & Adoption Factors
- BTR: Strong community support for Bitcoin Layer 2 solutions reflects growing demand for Bitcoin scalability
- OP: Established partnership network and infrastructure robustness provide adoption momentum across multiple use cases
III. Investment Value Thesis Components
Technology-Driven Growth Factors
Both projects depend on:
- Technological advancements in their respective domains (Bitcoin Layer 2 vs. general-purpose Layer 2)
- Market adoption rates for their infrastructure solutions
- Development velocity and ecosystem maturity progression
Risk Considerations
- Technological execution risk on scaling solutions
- Market adoption uncertainty for Layer 2 protocols
- Competitive landscape evolution in scaling solutions
- Regulatory environment changes affecting blockchain infrastructure
IV. Conclusion
BTR's investment case centers on Bitcoin Layer 2 infrastructure innovation with community-driven ecosystem development, while OP derives value from established blockchain ecosystem infrastructure and institutional partnerships. Both projects' performance correlates directly with blockchain technology adoption rates and the successful implementation of their respective scaling solutions.
Report Date: December 23, 2025
Disclaimer: This analysis is based on available reference materials and does not constitute investment advice. All cryptocurrency investments carry substantial risk.
III. 2025-2030 Price Forecast: BTR vs OP
Short-term Forecast (2025)
- BTR: Conservative $0.0265-$0.0279 | Optimistic $0.0357
- OP: Conservative $0.1877-$0.2761 | Optimistic $0.3948
Mid-term Forecast (2027-2028)
- BTR may enter consolidation phase with potential volatility, projected price range $0.0283-$0.0449
- OP may enter growth acceleration phase, projected price range $0.3205-$0.5696
- Key drivers: Institutional capital inflows, ETF adoption, ecosystem development expansion
Long-term Forecast (2029-2030)
- BTR: Base case $0.0366-$0.0469 | Optimistic scenario $0.0525-$0.0499
- OP: Base case $0.3854-$0.5381 | Optimistic scenario $0.5756-$0.5542
Disclaimer
This analysis is for informational purposes only and should not be considered as investment advice. Cryptocurrency market predictions are subject to significant uncertainty and volatility. Actual prices may differ substantially from forecasted values due to market dynamics, regulatory changes, and macroeconomic factors. Investors should conduct their own research and consult with financial professionals before making investment decisions.
BTR:
| 年份 | 预测最高价 | 预测平均价格 | 预测最低价 | 涨跌幅 |
|---|---|---|---|---|
| 2025 | 0.0357248 | 0.02791 | 0.0265145 | 0 |
| 2026 | 0.037226358 | 0.0318174 | 0.028953834 | 13 |
| 2027 | 0.0448784427 | 0.034521879 | 0.02830794078 | 23 |
| 2028 | 0.0416851688925 | 0.03970016085 | 0.037318151199 | 41 |
| 2029 | 0.052493537683912 | 0.04069266487125 | 0.036623398384125 | 45 |
| 2030 | 0.049854618367011 | 0.046593101277581 | 0.036808550009289 | 66 |
OP:
| 年份 | 预测最高价 | 预测平均价格 | 预测最低价 | 涨跌幅 |
|---|---|---|---|---|
| 2025 | 0.394823 | 0.2761 | 0.187748 | 0 |
| 2026 | 0.486419175 | 0.3354615 | 0.2683692 | 21 |
| 2027 | 0.45203437125 | 0.4109403375 | 0.32053346325 | 49 |
| 2028 | 0.569563307775 | 0.431487354375 | 0.37970887185 | 56 |
| 2029 | 0.57560413073625 | 0.500525331075 | 0.38540450492775 | 81 |
| 2030 | 0.554206672832793 | 0.538064730905625 | 0.495019552433175 | 95 |
Comparative Analysis Report: Bitlayer (BTR) and Optimism (OP) Investment Strategy
IV. Investment Strategy Comparison: BTR vs OP
Long-term vs Short-term Investment Strategies
BTR (Bitlayer):
- Suitable for investors focused on Bitcoin Layer 2 infrastructure innovation and early-stage ecosystem participation
- Long-term thesis centers on Bitcoin DeFi ecosystem expansion through native BitVM implementation
- Short-term trading requires high risk tolerance given extreme volatility and limited liquidity conditions
OP (Optimism):
- Suitable for investors seeking exposure to established Layer 2 infrastructure with institutional backing
- Long-term thesis benefits from ecosystem maturity and network effects within Ethereum scaling solutions
- Short-term positioning can leverage more stable liquidity and broader market recognition
Risk Management and Asset Allocation
Conservative Investors:
- BTR: 5-10% | OP: 30-40%
- Rationale: OP provides deeper liquidity, established partnerships, and longer market history reducing execution risk
Aggressive Investors:
- BTR: 20-30% | OP: 50-60%
- Rationale: BTR offers higher upside potential in Bitcoin Layer 2 narrative; OP provides portfolio stability through infrastructure-grade positioning
Hedging Instruments:
- Stablecoin allocation: 30-50% for entry/exit flexibility
- Diversification across Layer 2 solutions reduces single-protocol concentration risk
- Dollar-cost averaging recommended given sustained downward market pressure on both assets
V. Risk Comparison Analysis
Market Risk
BTR:
- Extreme price volatility (84.1% decline from ATH) indicates substantial drawdown risk
- Limited liquidity ($297,793 daily volume) creates execution slippage on position changes
- Concentrated holder base (37,448 addresses) elevates concentration risk
- Early-stage market discovery phase presents directional uncertainty
OP:
- Significant drawdown (84.3% from peak) demonstrates vulnerability to broad Layer 2 market sentiment
- 2% annual token inflation creates sustained selling pressure on price performance
- Market saturation in Ethereum Layer 2 ecosystem increases competitive pressure
- Larger holder base (1,357,251 addresses) provides relative stability
Technical Risk
BTR:
- First BitVM implementation execution risk—unproven track record for cross-chain bridge reliability
- Smart contract engine scalability under production load remains unvalidated
- Nascent ecosystem development increases protocol vulnerability surface area
OP:
- Optimistic Rollup design complexity may present unforeseen security vectors
- Network congestion scenarios could degrade transaction throughput performance
- Established architecture reduces novel technical risk but faces maturation phase challenges
Regulatory Risk
- Both Layer 2 solutions face uncertainty regarding regulatory classification of scaling infrastructure
- Bitcoin-specific regulation may impact BTR's ecosystem development timeline
- Ethereum regulatory developments directly influence OP's operating environment
- Cross-border regulatory divergence creates unpredictable compliance burden for both protocols
VI. Conclusion: Which Is the Better Buy?
📌 Investment Value Summary
BTR Strengths:
- Pioneering Bitcoin Layer 2 infrastructure with institutional backing ($30 million funding)
- Addresses underserved Bitcoin DeFi scaling narrative
- Early-stage positioning offers asymmetric upside potential for Bitcoin ecosystem believers
- Recent price consolidation near lows ($0.02799) may represent accumulation opportunity
OP Strengths:
- Established ecosystem with 97+ protocol integrations and $500M+ TVL
- Deeper liquidity ($977,144 daily volume) provides practical execution advantages
- Longer operational history reduces technological execution risk
- Institutional adoption through DeFi partnerships demonstrates market validation
- Superior market dominance (0.036% vs 0.00086%) reflects broader ecosystem recognition
✅ Investment Recommendations
Beginner Investors:
- Prioritize OP for portfolio exposure to Layer 2 infrastructure with established market presence
- Allocate maximum 10% portfolio weight to either asset given extreme market sentiment (Fear & Greed Index: 25)
- Implement dollar-cost averaging strategy over 3-6 months to mitigate volatile entry points
- Avoid leveraged positions given current market conditions
Experienced Investors:
- Consider BTR allocation (15-25%) if Bitcoin Layer 2 narrative conviction is high and risk tolerance supports drawdown scenarios
- Use OP as portfolio stabilizer within Layer 2 exposure (40-50% allocation)
- Employ technical analysis on 14.57% 7-day momentum for BTR swing trading opportunities
- Maintain hedging positions in stablecoins given Extreme Fear sentiment conditions
Institutional Investors:
- Allocate to OP as primary Layer 2 exposure due to liquidity depth, regulatory clarity advantage, and ecosystem maturity
- Consider BTR allocation (5-15%) for Bitcoin infrastructure diversification within emerging Layer 2 category
- Structure positions through staged accumulation given both assets' downward price trajectories
- Maintain separate ESG and risk compliance frameworks for early-stage (BTR) vs established (OP) infrastructure positions
⚠️ Risk Disclaimer: Cryptocurrency markets demonstrate extreme volatility with both BTR and OP experiencing 84%+ depreciation from peaks. This analysis is based on reference materials dated December 23, 2025, and does not constitute investment advice. All cryptocurrency investments carry substantial risk of total loss. Investors must conduct independent research and consult financial professionals before making allocation decisions. Market conditions, regulatory changes, and technological developments may materially impact asset valuations beyond forecast parameters presented herein. None
FAQ: Bitlayer (BTR) vs Optimism (OP) Investment Comparison
I. What are the key differences between Bitlayer (BTR) and Optimism (OP) in terms of technical architecture?
Answer: Bitlayer pioneers the first BitVM implementation, combining native Bitcoin security with a high-throughput smart contract engine specifically designed for Bitcoin Layer 2 scaling. Optimism operates as an Ethereum Layer 2 solution utilizing Optimistic Rollup technology, prioritizing simplicity and reduced transaction fees while maintaining Ethereum's security guarantees. BTR targets Bitcoin DeFi ecosystem expansion, while OP focuses on general-purpose Ethereum scaling infrastructure.
II. How do the current price performances and market volatility of BTR and OP compare?
Answer: BTR has declined 84.1% from its all-time high of $0.176 (September 2025) to the current price of $0.02799 (December 2025), exhibiting extreme volatility with 7-day gains of 14.57% offset by 30-day depreciation of -20.51%. OP has declined 84.3% from its all-time high of $4.84 (March 2024) to $0.2752, demonstrating more moderate volatility with -4.38% 7-day performance and -8.20% monthly depreciation. OP maintains significantly higher trading volume ($977,144) compared to BTR ($297,793), indicating deeper liquidity.
III. What are the primary risk factors investors should consider for each asset?
Answer: BTR faces extreme concentration risk with only 37,448 total addresses and limited liquidity relative to market capitalization, creating execution challenges. OP encounters sustained 2% annual supply inflation creating selling pressure, and faces intense competition within the mature Ethereum Layer 2 ecosystem. Both assets are vulnerable to extreme market sentiment (Fear & Greed Index at 25), significant drawdowns from peaks, technological execution risks in scaling solutions, and regulatory uncertainty affecting blockchain infrastructure classification.
IV. What is the institutional backing and ecosystem support for BTR and OP?
Answer: Bitlayer secured $30 million in funding from prominent investors including Polychain Capital, Franklin Templeton, Framework, ABCDE, StarkWare, and Alliance. Optimism maintains institutional partnerships with 97+ protocols including Synthetix, Uniswap, and Velodrome, with total locked value exceeding $500 million, demonstrating broader ecosystem integration and institutional validation compared to BTR's earlier-stage development phase.
V. Which asset would be more suitable for conservative versus aggressive investors?
Answer: Conservative investors should prioritize OP allocation (30-40%) due to deeper liquidity, established partnerships, and longer market history reducing execution risk. BTR suits aggressive investors (20-30% allocation) seeking higher upside potential in the emerging Bitcoin Layer 2 narrative. Both investors should maintain 30-50% stablecoin allocation for entry/exit flexibility given current Extreme Fear market sentiment and sustained downward price pressure on both assets.
VI. What are the 2025-2030 price forecast projections for BTR and OP?
Answer: For 2025, BTR's conservative range is $0.0265-$0.0279 with optimistic scenario at $0.0357, while OP ranges conservatively between $0.1877-$0.2761 with optimistic projection of $0.3948. By 2030, BTR is forecast at $0.0366-$0.0469 (base case) or $0.0525-$0.0499 (optimistic scenario), while OP projects to $0.3854-$0.5381 (base case) or $0.5756-$0.5542 (optimistic scenario). These forecasts depend on institutional capital inflows, ETF adoption, and ecosystem development expansion.
VII. Why does BTR present higher volatility and execution risk compared to OP?
Answer: BTR exhibits dramatically lower trading volume ($297,793 daily) relative to market capitalization ($7.3 million), creating wide bid-ask spreads and slippage risk on position changes. The holder base of 37,448 addresses represents extreme concentration compared to OP's 1,357,251 addresses. BTR's recent listing across only 19 exchanges limits accessibility, while OP's broader exchange availability ($977,144 daily volume) and larger circulating supply ratio (45.26% vs 26.16% for BTR) provide superior liquidity for institutional and retail execution.
VIII. What investment strategy would beginner investors adopt, and what are the recommended allocation parameters?
Answer: Beginner investors should prioritize OP exposure for Layer 2 infrastructure investment with established market presence, limiting portfolio weight to maximum 10% for either asset given Extreme Fear market sentiment. Implement dollar-cost averaging strategy over 3-6 months to mitigate volatile entry points, and avoid leveraged positions entirely. OP allocation (30-40%) combined with 30-50% stablecoin holdings provides downside protection during market drawdowns, while BTR exposure (5-10%) offers speculative Bitcoin ecosystem participation without excessive concentration risk.
Share
How to Buy Cryptocurrency


Trending Cryptocurrencies


BCH vs ARB: Comparing Two Crypto Assets in the DeFi Ecosystem

LRC vs BTC: Comparing the Potential of Loopring and Bitcoin in the Cryptocurrency Market
Is Hemi (HEMI) a good investment? An In-Depth Analysis of Performance, Risk Factors, and Future Prospects

What is Competitive Benchmarking in Crypto: Market Share, Performance, and Differentiation Strategy
5 Promising Cryptocurrencies to Consider for 2025

How Has the Price and Volatility of Crypto Evolved in 2025?

Xenea Daily Quiz Answer 24 december 2025

VARA vs MANA: Which Metaverse Token Offers Better Investment Potential in 2024?

How to Withdraw Funds from Hotbit After the Platform Shutdown
AI Predicts the 10 Cryptos Poised for Growth in 2025 | Expert Insights
What is SMTX: A Comprehensive Guide to Surface Mount Technology X and Its Applications in Modern Electronics Manufacturing