2025 VR Price Prediction: Expert Analysis on Virtual Reality Hardware Costs and Market Trends

Introduction: Market Position and Investment Value of VR
Victoria VR (VR) is a virtual reality metaverse platform designed to provide users with immersive VR experiences while enabling creators and active participants to earn rewards through various engagement mechanisms. As of December 18, 2025, Victoria VR has achieved a market capitalization of approximately $70.41 million, with a circulating supply of 16.8 billion VR tokens trading at around $0.004191. The platform distinguishes itself by offering a creator-centric ecosystem where users can build and monetize their own virtual worlds through work contributions, voting, task completion, token staking, and airdrops.
This article will provide a comprehensive analysis of Victoria VR's price trajectory and market outlook through 2030, examining historical price patterns, market dynamics, ecosystem development, and macroeconomic factors to deliver professional price forecasting and actionable investment strategies for market participants.
Victoria VR (VR) Market Analysis Report
I. VR Price History Review and Current Market Status
VR Historical Price Evolution
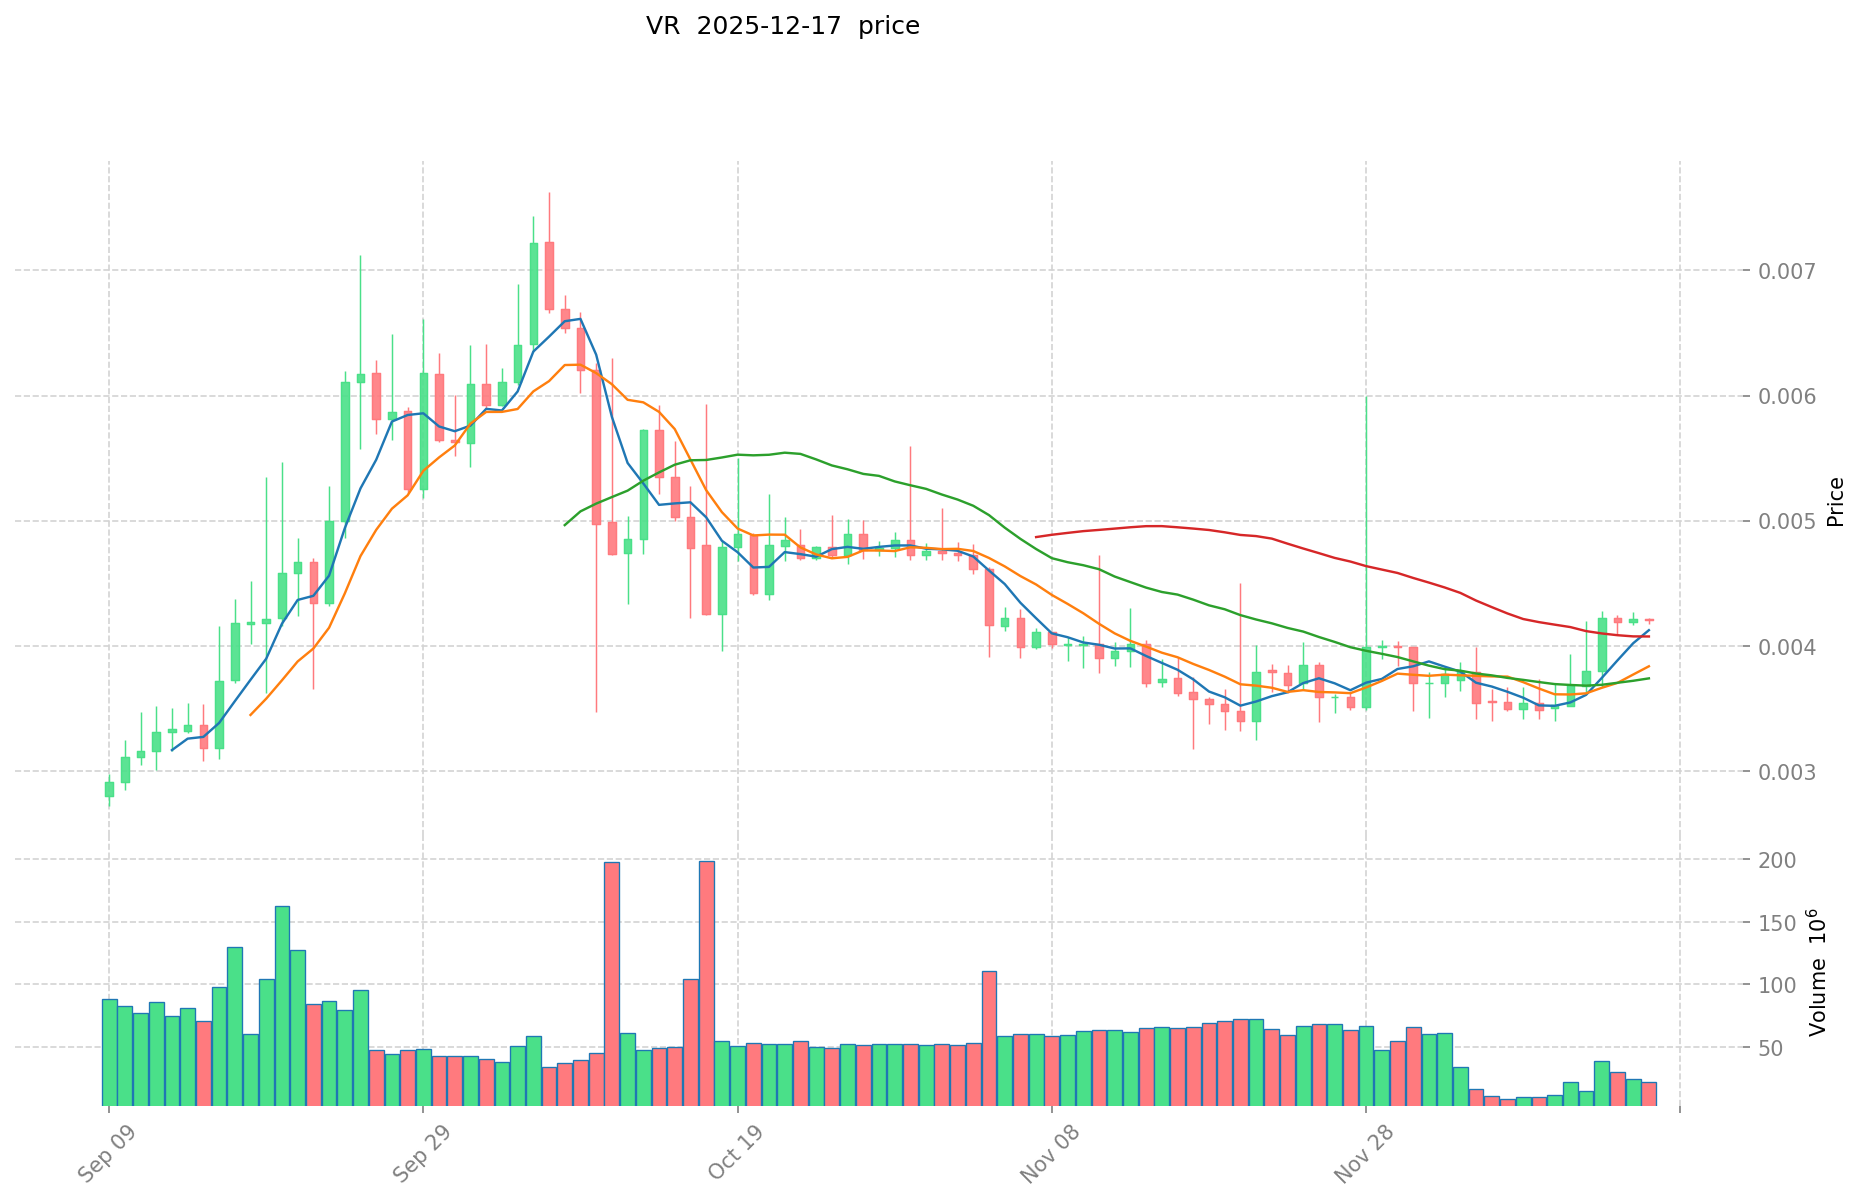
- December 2021: Project reached its all-time high of $0.615957, marking the peak of its market cycle during the 2021 bull run.
- Present Period: The token has experienced significant depreciation from its historical peak, currently trading at $0.004191 as of December 18, 2025, representing a decline of approximately 99.32% from the all-time high.
- Recent Low: On September 6, 2025, VR touched its all-time low of $0.00222735, demonstrating substantial downward pressure since its inception.
VR Current Market Status
Price Performance: Victoria VR is currently trading at $0.004191, with a 24-hour price change of 0%. Over a 1-hour timeframe, the token has shown a modest uptick of 0.05%. The 7-day and 30-day returns demonstrate stronger performance, with gains of 19.23% and 24.39% respectively over these periods. However, the 1-year performance reveals substantial losses, with the token down 63.24% over the past year.
Market Capitalization and Liquidity: The token maintains a market capitalization of $70,408,800 and ranks 413 in the overall cryptocurrency market by market cap. Daily trading volume stands at $109,597.68, with a market share of 0.0022%. The 24-hour trading range fluctuates between $0.004137 and $0.004247.
Supply Metrics: Victoria VR has a total supply of 16.8 billion tokens, with all tokens currently in circulation, representing a 100% circulation ratio. The fully diluted valuation aligns with the current market cap at $70,408,800, indicating that the entire token supply is already in circulation.
Holder Distribution: The token is distributed among 13,033 unique holders, and it is currently listed on 5 cryptocurrency exchanges, with active trading available on Gate.com.
View current VR market price
VR Market Sentiment Index
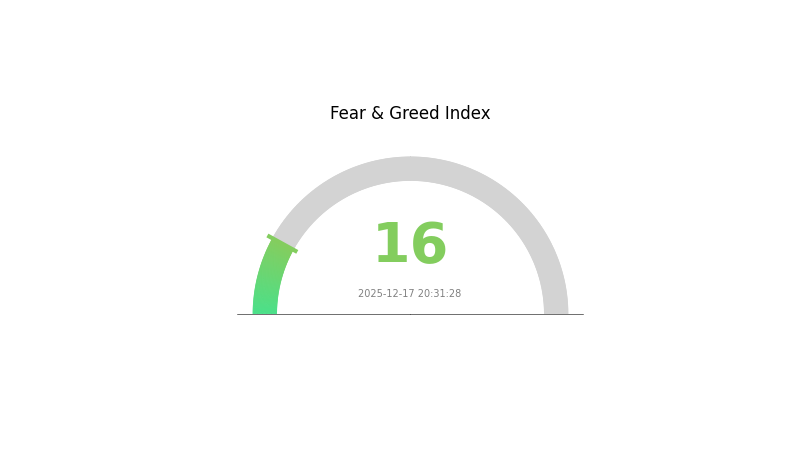
2025-12-17 Fear and Greed Index: 16 (Extreme Fear)
Click to view the current Fear & Greed Index
The crypto market is experiencing extreme fear, with the Fear and Greed Index hitting 16. This reading indicates significant market pessimism and heightened risk aversion among investors. When the index reaches such lows, it typically signals oversold conditions and potential buying opportunities for contrarian traders. However, investors should remain cautious and conduct thorough research before entering positions. This extreme fear sentiment often precedes market stabilization or recovery phases, making it a critical moment for portfolio rebalancing and risk management strategies.
VR Holdings Distribution
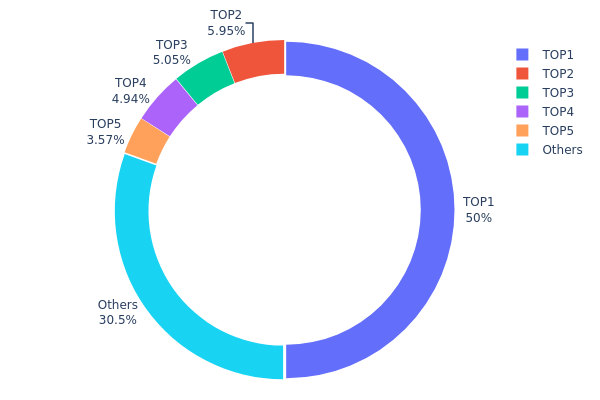
An address holdings distribution chart illustrates the concentration pattern of token ownership across blockchain addresses, revealing how VR tokens are allocated among individual holders. This metric serves as a critical indicator of market structure, decentralization levels, and potential systemic risks associated with token concentration.
The current VR holdings distribution exhibits significant concentration concerns. The top address commands 50.00% of total token supply, representing an exceptionally high level of centralization that substantially exceeds healthy decentralization thresholds. When combined, the top five addresses collectively hold 69.5% of all VR tokens in circulation, leaving only 30.5% distributed among remaining holders. This distribution pattern suggests pronounced concentration risk, with a single dominant stakeholder wielding extraordinary influence over the token's ecosystem and governance mechanisms.
Such extreme concentration creates material implications for market dynamics and price stability. The presence of a mega-holder controlling half the circulating supply introduces elevated volatility risks and potential market manipulation concerns, as large-scale liquidations or strategic accumulation by this address could trigger substantial price movements. Additionally, the concentrated ownership structure may impede organic market-driven price discovery and limit the depth of decentralized governance participation. The current holdings distribution underscores a nascent phase of development where token decentralization remains incomplete, with market maturation contingent upon broader distribution patterns and reduced reliance on major individual holders.
Click to view current VR Holdings Distribution
| Top | Address | Holding Qty | Holding (%) |
|---|---|---|---|
| 1 | 0x27e6...c5f721 | 8400000.00K | 50.00% |
| 2 | 0xc3f9...f87152 | 999999.90K | 5.95% |
| 3 | 0x9b87...6048bc | 848000.10K | 5.04% |
| 4 | 0x6d6c...797fec | 830000.00K | 4.94% |
| 5 | 0x175c...69c9cc | 600000.00K | 3.57% |
| - | Others | 5122000.00K | 30.5% |
II. Core Factors Impacting VR's Future Price
Supply Mechanism
-
Device Cost Structure: VR hardware costs are composed of multiple components including chipsets (approximately 37% of total cost), screens (17%), cameras (14%), optical systems (8%), batteries and power supplies (5%), ODM/OEM services (5%), and structural components (5%). These component costs directly influence final product pricing and market accessibility.
-
Optical Technology Evolution: The VR industry is transitioning from Fresnel lens technology to Pancake optical solutions. Pancake technology reduces device weight from 400-500g to 200-300g and module thickness from 40-50mm to 15-20mm, potentially reducing overall device volume to one-quarter of previous designs. Single Pancake component pricing ranges from ¥150-200 compared to ¥15-20 for Fresnel lenses, indicating that technological advancement will initially increase component costs before economies of scale drive prices down.
-
Current Impact: As Pancake becomes the preferred optical standard for consumer-grade VR devices over the next 3-5 years through adoption by Meta, Apple, Pico, and Huawei, manufacturing costs will gradually decline. This technological transition will create near-term price pressures but drive long-term affordability improvements.
Machine and Major Holder Dynamics
-
Enterprise Supply Chain: Major ODM manufacturers including Goertek (producing 70% of global mid-to-high-end VR devices), Quanta Services, Compal Electronics, and Flex are expanding production capacity. These manufacturers serve major clients including Meta, Microsoft, Google, Apple, Sony, and Huawei, indicating institutional commitment to VR ecosystem development.
-
Market Consolidation: As of January 2025, Infinite Reality secured $3 billion in funding following acquisitions of Landvault and The Drone Racing League, raising its valuation to $12.25 billion. This demonstrates significant institutional investment momentum in VR infrastructure and content ecosystems.
Macroeconomic Environment
-
Consumer Affordability: Device cost remains the primary barrier to mainstream VR adoption. While prices have declined, high-quality VR equipment still represents significant consumer investment. Price sensitivity persists across market segments, with market penetration heavily influenced by price positioning across different geographic regions and income levels.
-
Market Penetration Dynamics: Market saturation levels directly impact VR sector growth trajectories. Lower-tier cities and regions with limited entertainment infrastructure show different consumption patterns compared to developed markets. Geographic market diversification will be critical to future price stability.
Technology Development and Ecosystem Building
-
Pancake Optical Technology Advancement: The shift to Pancake folded optical design represents a major technological evolution. This technology enables zero-distortion full-spectrum high-definition visual experiences while significantly reducing device thickness and weight. The transition from Fresnel to Pancake solutions will drive device form-factor improvements and enhance user experience, supporting sustained market growth.
-
Content Ecosystem Development: The industry is transitioning from hardware subsidies to content-focused strategies. Integration of software and hardware development creates positive feedback loops, where improved ecosystems stimulate shipment increases. Enterprise-level VR training adoption is projected to grow at 8.2% annually across global markets, particularly in North America and Europe, expanding addressable market segments beyond consumer gaming.
-
5G and Wireless Content Delivery: 5G-enabled wireless VR content transmission at the edge represents a medium-term growth catalyst (2-4 years), particularly in Asia-Pacific markets with expansion potential to North America. This infrastructure development will enable new business models and reduce device processing requirements, supporting price optimization strategies.
III. VR Price Forecast 2025-2030
2025 Outlook
- Conservative Forecast: $0.00277 - $0.00419
- Base Case Forecast: $0.00419
- Optimistic Forecast: $0.00608
2026-2028 Medium-term Outlook
- Market Phase Expectation: Recovery and gradual accumulation phase with modest growth trajectory as market participants rebuild confidence and establish positions.
- Price Range Predictions:
- 2026: $0.00375 - $0.00539 (expected 22% upside potential)
- 2027: $0.00505 - $0.00711 (expected 25% appreciation)
- 2028: $0.00600 - $0.00773 (expected 47% growth)
- Key Catalysts: Institutional adoption expansion, technological protocol upgrades, increased utility integration, and broader cryptocurrency market sentiment improvement.
2029-2030 Long-term Outlook
- Base Case Scenario: $0.00695 - $0.00892 (assuming sustained ecosystem development and moderate market expansion)
- Optimistic Scenario: $0.00810 - $0.00925 (with accelerated mainstream adoption and strategic partnerships)
- Transformational Scenario: $0.00925+ (under conditions of breakthrough technology implementation, significant institutional capital inflows, and regulatory clarity)
- Performance Milestone: By 2030, VR demonstrates cumulative appreciation of approximately 93% from 2025 baseline levels, reflecting strengthening fundamental adoption metrics.
| 年份 | 预测最高价 | 预测平均价格 | 预测最低价 | 涨跌幅 |
|---|---|---|---|---|
| 2025 | 0.00608 | 0.00419 | 0.00277 | 0 |
| 2026 | 0.00539 | 0.00514 | 0.00375 | 22 |
| 2027 | 0.00711 | 0.00526 | 0.00505 | 25 |
| 2028 | 0.00773 | 0.00618 | 0.006 | 47 |
| 2029 | 0.00925 | 0.00696 | 0.00397 | 65 |
| 2030 | 0.00892 | 0.00811 | 0.00486 | 93 |
Victoria VR (VR) Investment Analysis Report
I. Project Overview
Basic Information
Victoria VR is a virtual reality ecosystem token designed to provide users with immersive VR experiences and reward participation. The project is built on the Ethereum blockchain with the contract address 0x7d5121505149065b562c789a0145ed750e6e8cdd.
Token Metrics (as of December 18, 2025):
- Current Price: $0.004191
- Market Capitalization: $70,408,800
- Circulating Supply: 16,800,000,000 VR
- Total Supply: 16,800,000,000 VR
- Market Rank: #413
- Holders: 13,033
Project Mission
Victoria VR world provides users with advanced virtual reality technology designed for continuous engagement. The ecosystem is built from the ground up to enable users to create their own world. Creators and active users earn regular and fair rewards through work contributions, voting, commenting, task completion, VR token staking, and random airdrops.
II. Market Performance Analysis
Price Performance Metrics
| Time Period | Price Change | Details |
|---|---|---|
| 1 Hour | +0.05% | Minimal volatility |
| 24 Hours | 0% | Neutral movement |
| 7 Days | +19.23% | +$0.000676 |
| 30 Days | +24.39% | +$0.000822 |
| 1 Year | -63.24% | -$0.00721 |
Historical Price Range:
- All-Time High: $0.615957 (December 11, 2021)
- All-Time Low: $0.00222735 (September 6, 2025)
- 24H High: $0.004247
- 24H Low: $0.004137
Market Liquidity
- 24-Hour Trading Volume: $109,597.68
- Listed on 5 exchanges
- Gate.com trading available
Market Position
Victoria VR represents 0.0022% of the total cryptocurrency market cap. The token demonstrates modest liquidity with approximately 13,033 active holders.
III. Token Utility & Economics
Reward Mechanism
The VR token incentivizes ecosystem participation through multiple channels:
- Creator Rewards: Content creators receive compensation for their work
- Community Participation: Users earn rewards for voting and commenting
- Task Completion: Active users gain tokens through task participation
- Token Staking: Holders can stake VR tokens for additional rewards
- Airdrop Programs: Random airdrops distributed to active community members
Token Distribution
- Circulating Supply Ratio: 100%
- No additional supply inflation expected
- Fully diluted valuation aligns with current market cap at $70,408,800
IV. Professional Investment Strategy & Risk Management
Investment Methodology
(1) Long-Term Holding Strategy
- Suitable for: Patient investors with high risk tolerance interested in metaverse and VR ecosystem development
- Operation Recommendations:
- Accumulate during market downturns when VR price remains significantly below historical highs
- Hold positions for 12-24 months to benefit from potential ecosystem growth
- Dollar-cost averaging approach to reduce entry point volatility
- Storage Solution: Utilize Gate.com wallet for secure asset custody with convenient staking options for token rewards
(2) Active Trading Strategy
- Technical Analysis Tools:
- Support and Resistance Levels: Identify key price zones at $0.004137 (24H low) and $0.004247 (24H high) for entry/exit signals
- Moving Averages: Apply 7-day and 30-day moving averages to track trend direction given recent 19.23% and 24.39% gains respectively
- Wave Trading Key Points:
- Monitor 24-hour volume spikes above $109,597 baseline for breakout confirmation
- Enter positions during oversold conditions relative to 30-day moving average
- Exit upon reaching resistance levels or on volume decline confirmation
Risk Management Framework
(1) Asset Allocation Principles
- Conservative Investors: 1-2% of portfolio allocation (microcap speculation only)
- Active Investors: 3-5% of portfolio allocation (with stop-loss orders at -15%)
- Professional Investors: 5-10% of portfolio allocation (with hedging strategies and diversification)
(2) Risk Hedging Solutions
- Portfolio Diversification: Combine VR holdings with established cryptocurrencies and traditional assets to reduce concentration risk
- Position Sizing: Never exceed 10% of total portfolio in any single microcap token; use position sizing to limit downside exposure
(3) Security Storage Solutions
- Hot Wallet Recommendation: Gate.com Web3 wallet for frequent trading and staking participation with real-time reward collection
- Cold Storage Approach: Transfer majority holdings to secure offline storage for long-term positions exceeding 6 months
- Security Considerations: Enable two-factor authentication on all exchange accounts, use hardware-backed security keys, and never share private keys or seed phrases
V. Potential Risks & Challenges
Market Risks
- Extreme Volatility: Token experienced 63.24% decline over 12 months and has recovered only partially; price swings of 19-24% monthly create significant portfolio impact
- Low Trading Liquidity: Daily volume of $109,597 across 5 exchanges limits entry/exit flexibility for larger positions
- Microcap Classification: With rank #413 and relatively small market cap, VR remains susceptible to pump-and-dump dynamics and market manipulation
Regulatory Risks
- Unclear Regulatory Status: VR token classification as utility or security remains ambiguous in major jurisdictions
- Compliance Uncertainty: Future regulatory actions against metaverse projects or virtual economy platforms could negatively impact project viability
- Geographic Restrictions: Potential trading bans or restrictions in certain jurisdictions may limit market access
Technology Risks
- Blockchain Dependency: Single-chain deployment on Ethereum creates technical bottlenecks and limits scalability
- Smart Contract Vulnerabilities: Historical smart contract exploits in DeFi and metaverse projects pose ongoing security concerns
- Ecosystem Development: Project success depends entirely on user adoption and creator participation growth in competitive metaverse market
VI. Conclusions & Action Recommendations
Victoria VR Investment Value Assessment
Victoria VR operates within the highly speculative virtual reality and metaverse sector. The token shows recent short-term recovery (+24% in 30 days) but remains down 63% year-over-year, reflecting broader market skepticism toward metaverse projects. The project's decentralized reward mechanism and creator economy focus present conceptual merit, but execution risk remains elevated. The token's current market position as a microcap asset with limited liquidity restricts accessibility for institutional investors and increases volatility for retail participants.
Investment Recommendations
✅ Beginners: Allocate only 1-2% of portfolio to VR token as high-risk speculation. Use Gate.com for safe purchasing and storage. Learn about metaverse fundamentals and virtual economy models before increasing exposure. Implement strict stop-loss orders at -20% to protect capital.
✅ Experienced Investors: Consider 3-5% allocation if metaverse ecosystem thesis aligns with portfolio strategy. Execute dollar-cost averaging during support zone ($0.004137) and take profits at resistance ($0.004247). Monitor project development roadmap and community engagement metrics quarterly.
✅ Institutional Investors: Position sizing typically limited to 5-10% maximum due to liquidity constraints. Require comprehensive due diligence on team credentials, development progress, and regulatory compliance. Implement multi-signature cold storage and derivative hedging strategies. Negotiate direct liquidity agreements for large position accumulation.
Trading Participation Methods
- Direct Purchase: Buy VR tokens on Gate.com exchange using fiat or cryptocurrency transfers; execute limit orders to avoid slippage
- Staking Programs: Participate in token staking through Victoria VR ecosystem to earn passive rewards; lock tokens for extended periods when confident in long-term thesis
- Community Participation: Engage in task completion, voting, and content creation within Victoria VR platform to earn additional token rewards beyond trading
Cryptocurrency investment carries extreme risk. This report does not constitute investment advice. Investors must carefully evaluate their risk tolerance and financial situation before participating in virtual reality or metaverse-related assets. Always consult professional financial advisors before making investment decisions. Never invest more capital than you can afford to lose completely.
FAQ
Will vet reach $1?
For VET to reach $1, it would need approximately 35x growth from current levels. This is achievable if VeChain gains significant enterprise adoption and carbon credit market integration. While ambitious, it remains possible by 2030 with sustained blockchain ecosystem expansion.
What is the forecast for the VR market?
The VR market is projected to reach USD 123.06 billion by 2032, growing from USD 20.83 billion in 2025 with a CAGR of 28.9%. This robust growth reflects increasing adoption across consumer and enterprise sectors globally.
What will VeChain be worth in 2025?
VeChain is predicted to reach approximately $0.074 in 2025, based on continued market adoption and growth trends. Long-term bullish targets suggest potential reaching $7.62 by 2030.
Is VRC coin a good investment?
VRC shows stable price performance near $0.0339 with low volatility. Market analysts project modest growth potential. Consider your risk tolerance and investment goals before deciding.
Share
Content
Introduction: Market Position and Investment Value of VR
I. VR Price History Review and Current Market Status
II. Core Factors Impacting VR's Future Price
III. VR Price Forecast 2025-2030
I. Project Overview
II. Market Performance Analysis
III. Token Utility & Economics
IV. Professional Investment Strategy & Risk Management
V. Potential Risks & Challenges
VI. Conclusions & Action Recommendations
FAQ
How to Buy Cryptocurrency


Trending Cryptocurrencies


XZXX: A Comprehensive Guide to the BRC-20 Meme Token in 2025

Bitcoin Fear and Greed Index: Market Sentiment Analysis for 2025
Top Crypto ETFs to Watch in 2025: Navigating the Digital Asset Boom

5 ways to get Bitcoin for free in 2025: Newbie Guide

Bitcoin Market Cap in 2025: Analysis and Trends for Investors

2025 Bitcoin Price Prediction: Trump's Tariffs' Impact on BTC

2025 GIGGLE Price Prediction: Analyzing Market Trends and Future Growth Potential for the Emerging Cryptocurrency Token
2025 LRC Price Prediction: Expert Analysis and Future Outlook for Loopring Token

2025 WAVES Price Prediction: Expert Analysis and Market Outlook for the Next Bull Run

2025 USELESS Price Prediction: Expert Analysis, Market Trends, and Investment Outlook for the Next 12 Months

Is Tagger (TAG) a good investment?: A Comprehensive Analysis of Market Potential, Risk Factors, and Future Growth Prospects